
Fig 1.
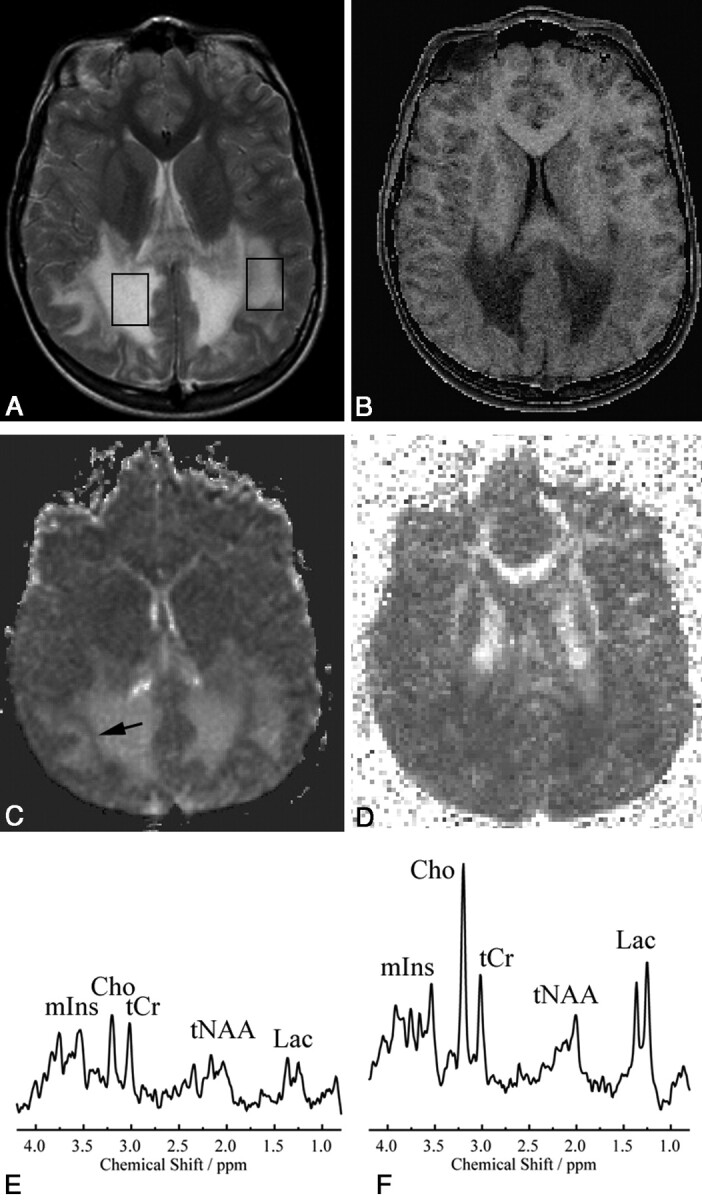
VOI localizations for MRS (STEAM: TR, 6000 ms; TE, 20 ms; mixing time, 10 ms; 64 accumulations) are shown on a transverse T2-weighted MR image (TR, 3000 ms; TE, 120 ms; 1 signal intensity acquired) (A) with MTR (B), ADC (C), and FA (D) maps of the same section and corresponding spectra (E and F) in a patient with X-ALD. The VOI placed in the center of the white matter lesion (right hemisphere) shows a very low MTR, high ADC, low FA, very low tNAA, low tCr, high mIns and Cho, and high Lac. The VOI at the edge of the lesion shows similar but less pronounced changes; Cho and Lac are higher here than in the center of the lesion. Also note the band of low ADC (arrow in C) toward the edge of the lesion.