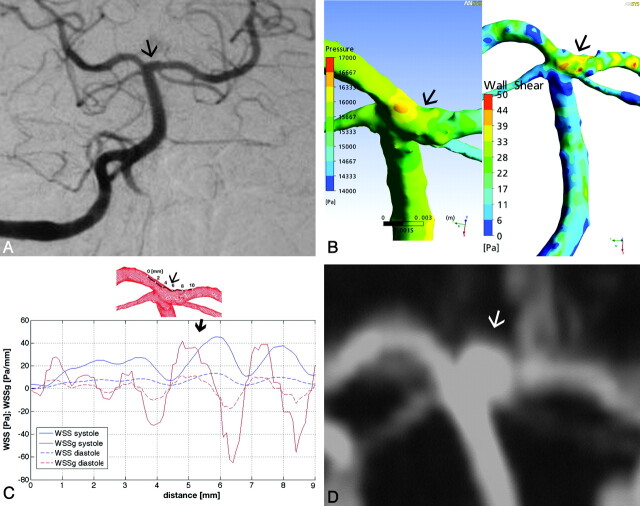
Fig 1.
A, Basilar artery. Posteroanterior Townes view DSA of patient 1 shows no aneurysm at the basilar bifurcation. B, Surface pressure (left) and WSS distribution map (right) demonstrate significant forces attacking the basilar tip. C, Along the arbitrarily defined line, the diagram shows a major peak in SWSSG at point 5 (thin arrow), followed immediately by a WSS peak (thick arrow). D, This point corresponds to the proximal edge of the later developed aneurysm neck as shown by the time-of-flight MRA (arrow indicates the future aneurysm site on A, B, C, and the developed aneurysm on D).

