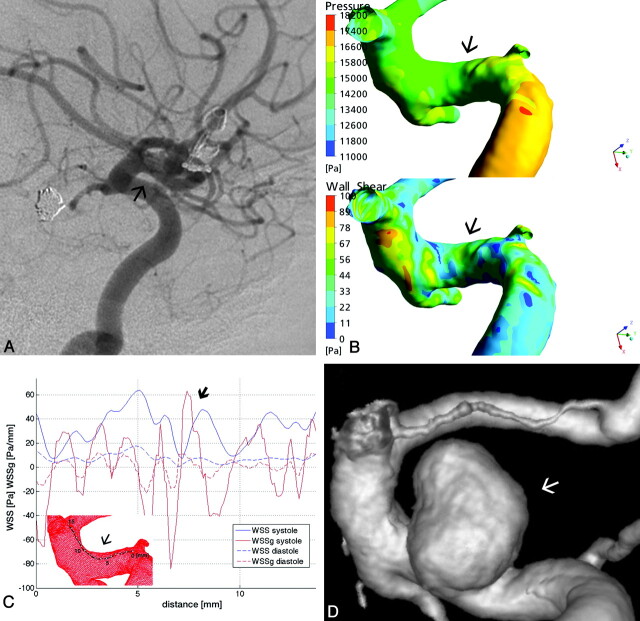
Fig 2.
A, Right ICA lateral view DSA of patient 2 shows no aneurysm at the upper wall of the C2 ICA segment (arrow). B, Surface pressure (upper) and WSS distribution map (lower) demonstrate increased forces at the site of future aneurysm. C, Along the arbitrarily defined line, the diagram shows a major peak in SWSSG approximately at point 3 (thin arrow), followed immediately by a WSS peak at point 5 (thick arrow). D, The first combined peak is followed by a second at approximately points 7–8, which fell later into the neck area of the developed aneurysm, as seen on the 3D reconstructed angiogram.

