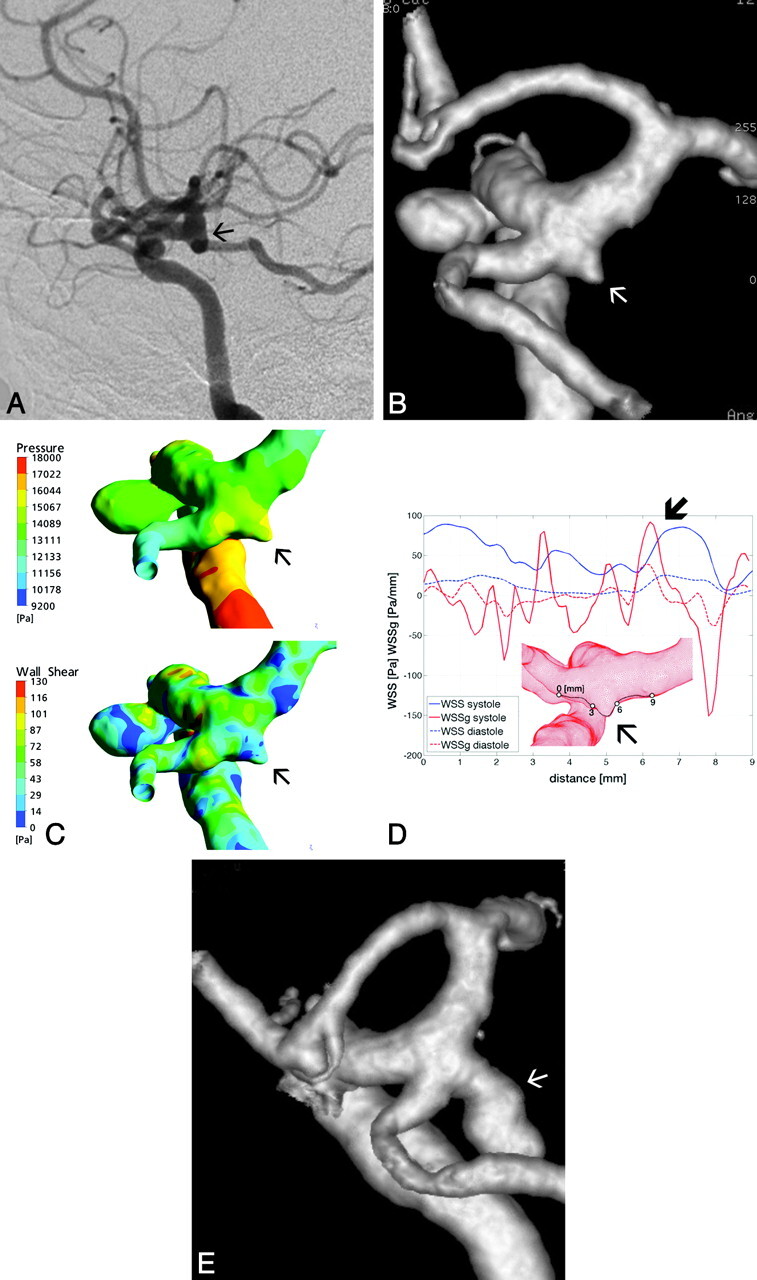
Fig 4.

A and B, Lateral view DSA of the right ICA of patient 3 shows an aneurysm at the carotid cave; however, no aneurysm beginning is visible at the origin of the PcomA (A), demonstrated by the 3D reconstruction angiogram (arrows, B). C, Surface pressure (upper) and WSS distribution map (lower) demonstrate increased forces at the edges of the tiny aneurysm beginning (arrows). D, Along the arbitrarily defined line, the diagram shows a first major peak in SWSSG approximately after point 3, followed immediately by a lower WSS peak and again at points 6 and 7 respectively (thick arrow). E, These points correspond to the proximal and distal edges of the aneurysm beginning, which further evolved to a larger aneurysm that ruptured (arrow).
