
Fig 5.
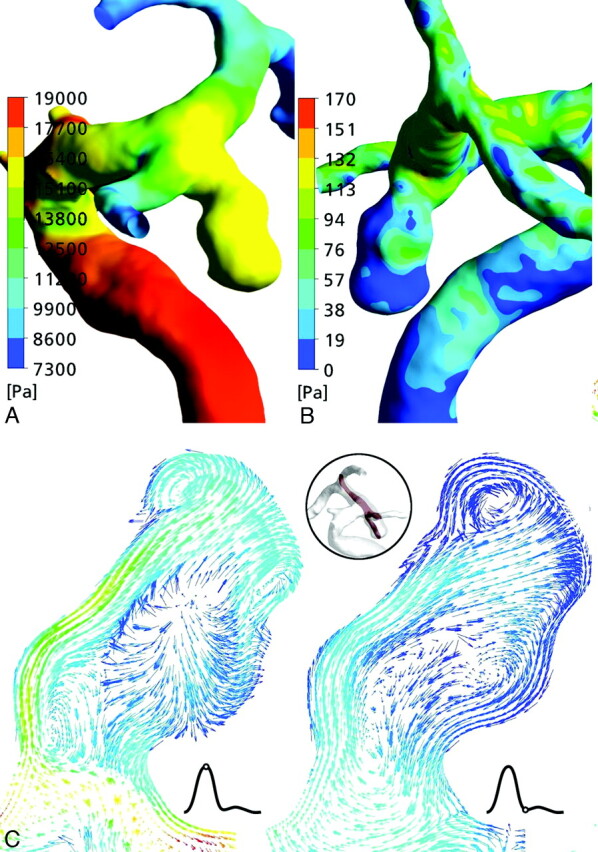
A and B, Surface pressure (A) and WSS distribution (B) on the aneurysm wall of patient 3. C, The velocity vector fields show a changing impingement zone at the aneurysm dome throughout the cardiac cycle and changing multiple vortices in the aneurysm lumen.