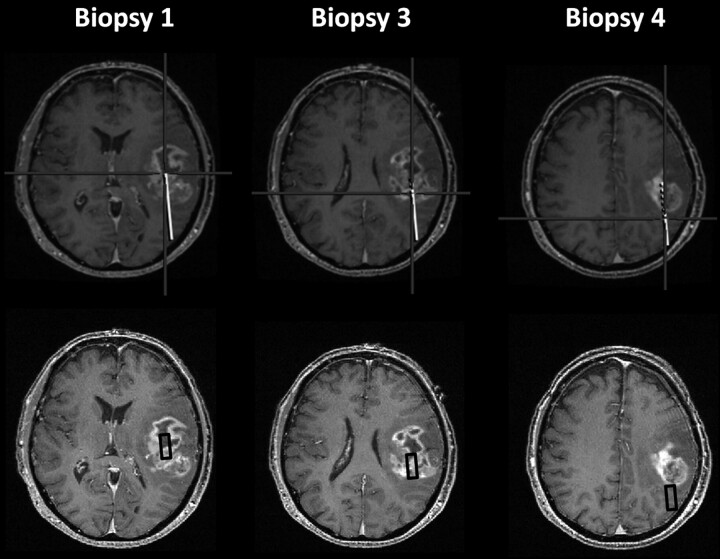
Fig 1.
An example of how the regions of interest were determined in this patient with a glioblastoma. The upper panel shows the images from the image-guidance system, and the lower panel shows the SPGR image with the region of interest corresponding to this biopsy site (black box). The center of the region of interest is located at the biopsy site, and the orientation is in line with the biopsy tract.

