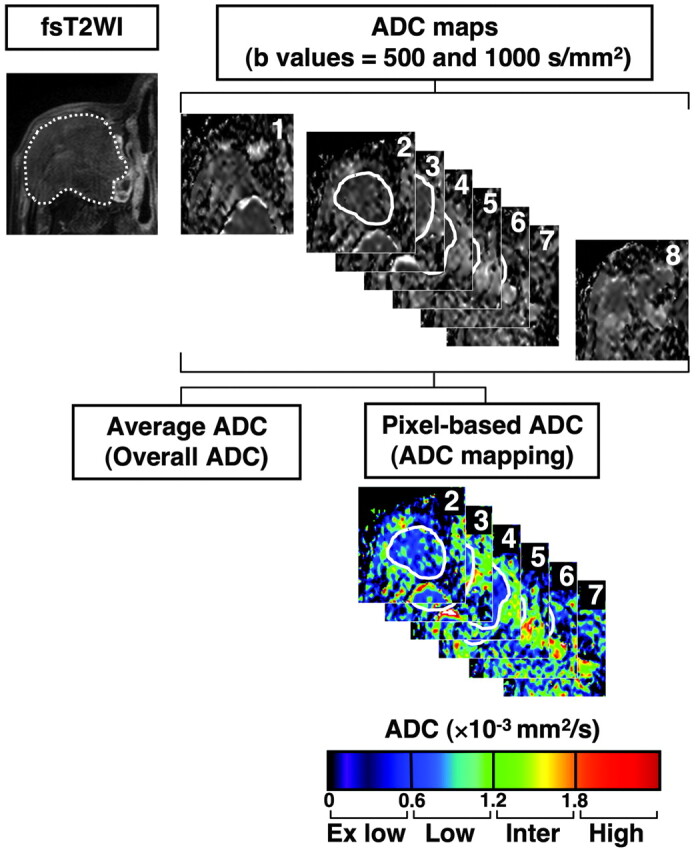
Fig 1.

Overall ADC and ADC mapping. MR images are from a 77-year-old man with well-differentiated SCC. Regions of interest were manually placed on all sequential 2D ADC maps that contained tumor areas (continuous white lines on ADC maps 2–7), except for the upper- and lowermost sections (in this case, ADC maps 1 and 8), and onto the tumor areas of ADC maps by using the corresponding FS T2-weighted images as references for the regions of interest (broken white line). Then, average ADCs (overall ADCs) of the whole tumor areas were calculated. In addition, relative tumor areas with extremely low, low, intermediate, or high ADCs were separately determined and expressed as percentages of total tumor area (ADC mapping). The total time required for the ADC analyses was <10 minutes per patient. Overall ADC = 0.91 × 10⁻³ mm2/s; ADC mapping of tumor areas (percentages) with extremely low/low/intermediate/high ADCs = 6 /84/9/0.
