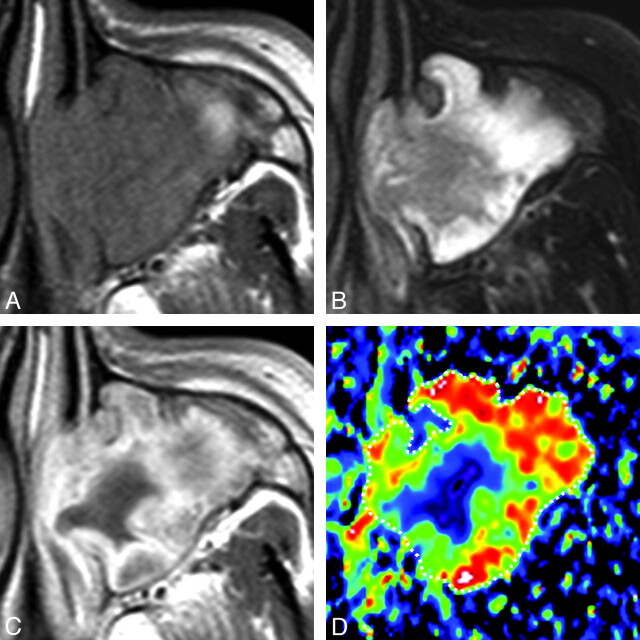
Fig 2.
A 46-year-old man with rhinosinusitis. A, Axial T1-weighted MR image (TR/TE = 500/15 ms) shows the left maxillary sinus filled with homogeneous inflammatory tissues. B, Axial FS (SPAIR) T2-weighted MR image (TR/TE = 6385/80 ms) shows the left maxillary sinus filled with heterogeneous inflammatory tissues. C, Axial contrast-enhanced T1-weighted MR image (TR/TE = 500/15 ms) shows heterogeneously enhanced tissue in the left maxillary sinus. D, Axial color ADC map shows high ADC areas in the lesion periphery. Overall ADC = 2.0 × 10⁻³ mm2/s. Areas with extremely low, low, intermediate, and high ADCs occupy 2%, 8%, 24%, and 66%, respectively, of the lesion.

