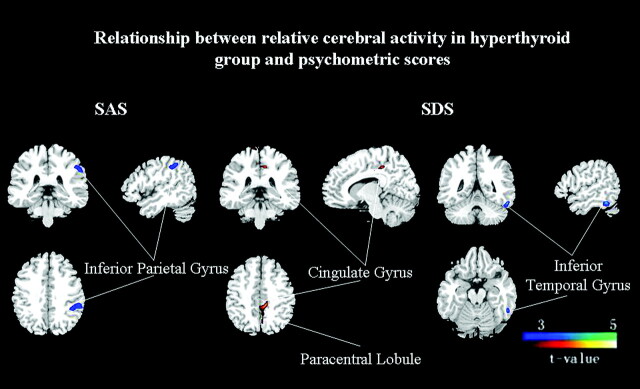
Fig 2.
Covariation of relative brain activity before treatment in the hyperthyroid group with psychometric scores (uncorrected P < .001). Blue areas exhibit negative correlation and red areas exhibit positive correlation between the psychometric score and normalized glucose metabolism in the patients with hyperthyroidism.

