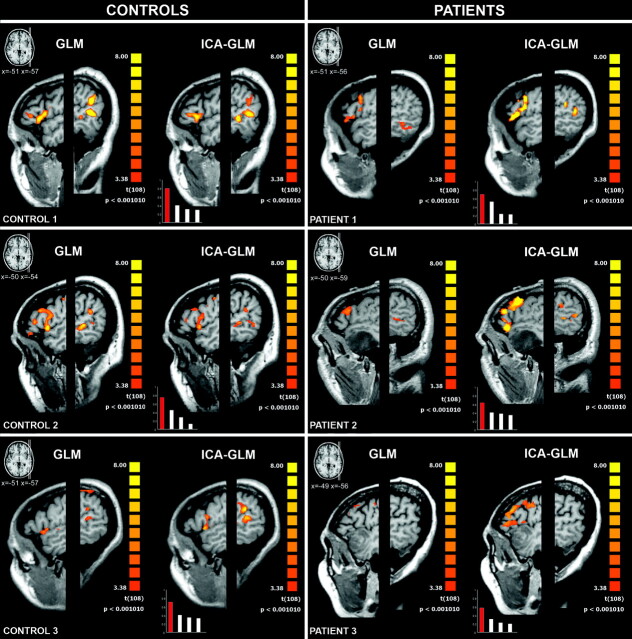
Fig 3.
GLM (left column) and ICA-GLM (right column) activations (P < .001, uncorrected) during VGt in representative controls and patients. The left hemispheres are displayed with different Talairach x-values, to visualize the IFG (Broca area) and TPJ (Wernicke area). The bar charts in the lower left-hand corners show the correlation coefficients of the first 4 ICs and the task predictor; the chosen IC is displayed in red. In controls, both the GLM and ICA-GLM show activation in the IFG and TPJ. In patient 1 (left parietal glioma), the ICA-GLM activates both the IFG and TPJ, whereas the GLM activates only the IFG. In patient 2 (left temporal glioma), the ICA-GLM activates both the IFG and TPJ, whereas no language regions are detected with the GLM. In patient 3 (left temporal glioma), the ICA-GLM activates only the IFG, whereas no language regions are detected with the GLM.

