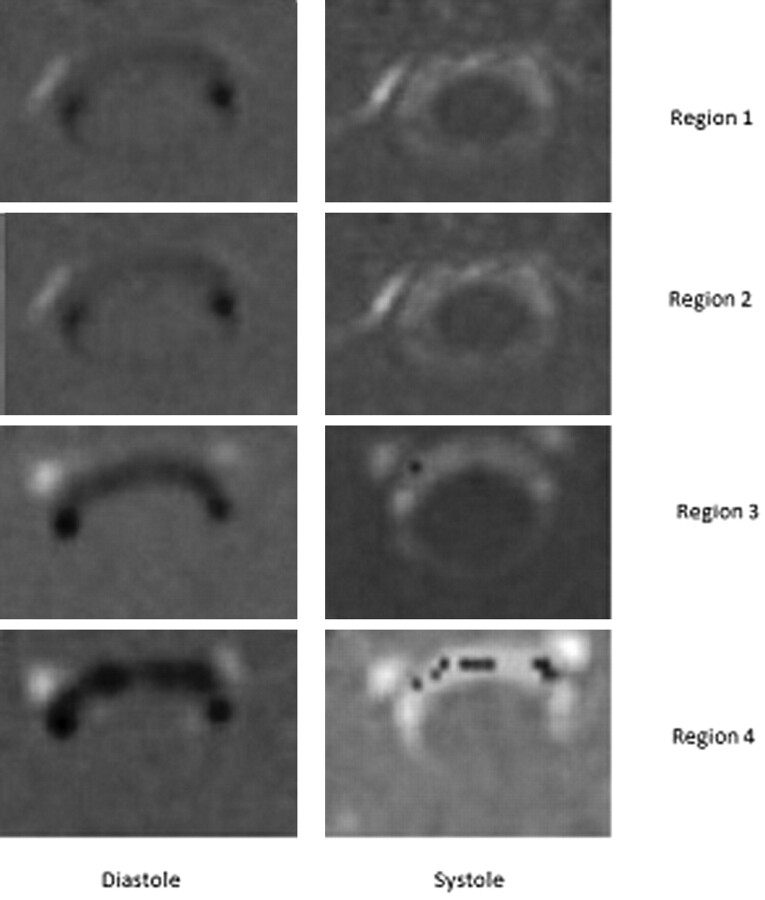
Fig 2.
PCMR axial flow images from diastole (left column) and systole (right column) in each of the 4 regions in a patient with tonsilar ectopia. Systolic flow (away from the head) has a positive (bright) signal intensity, and diastolic flow (toward the head) has a dark signal intensity. Flow patterns have greater inhomogeneity and higher velocities as the distance from the foramen magnum increases. PDVs in this patient are respectively 3.7, 2.9, 7.0, and 8.0 cm/s in regions 1 though 4; PSVs are 5.2, 5.6, 6.8, and 10.4 cm/s. In systolic flow images in regions 3 and 4, paradoxical negative signal intensity indicative of aliased flow is noted in the regions of high positive flow.

