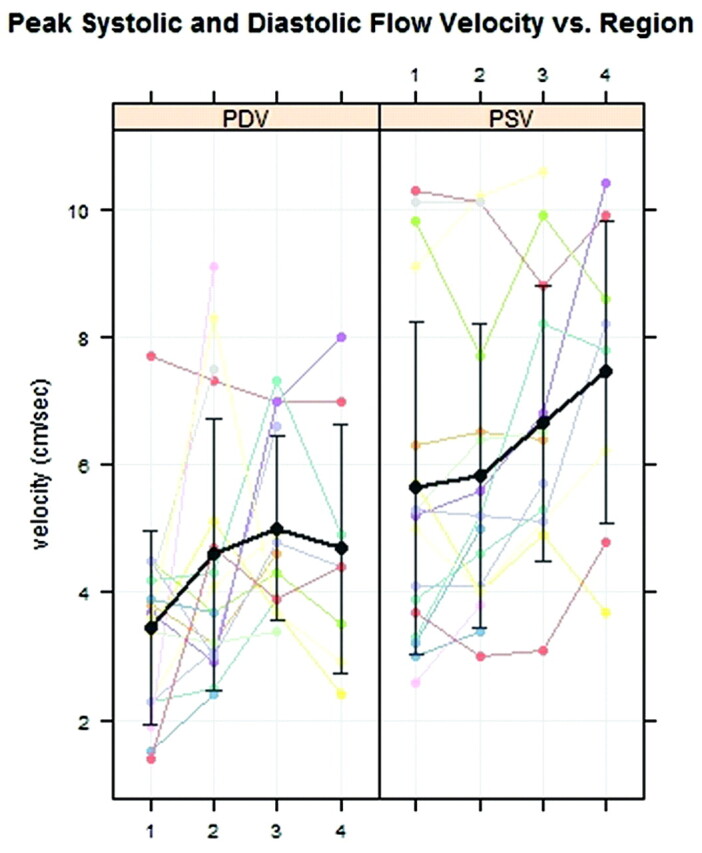
Fig 3.

PDV and PSV at regions 1 through 4 in 17 patients with multilevel CSF flow studies. The average PSV (black line) increases progressively over the 4 regions. The average PDV (black line) increases over the first 3 regions. Error bars display 1 SD.
