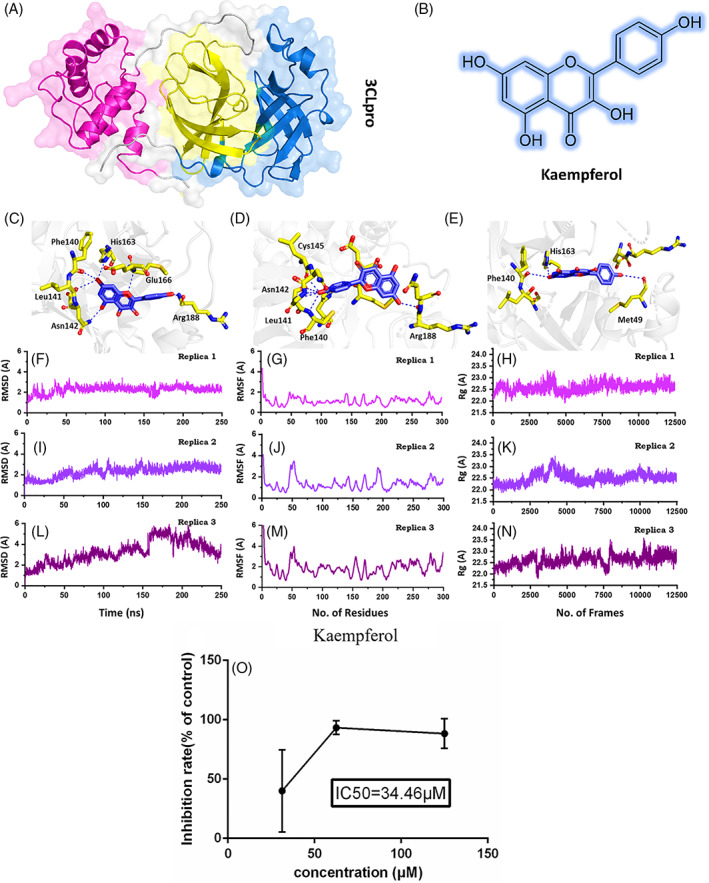
FIGURE 1.

(A) Shows the structure of 3CLpro and its different domains. (B) Shows the 2D structure of kaempferol. (C–E) Show the binding mode of kaempferol each conformation. (F–H) Show the RMSd of the three best conformations. (I–K) Show the RMSf of the three best conformations. (L–N) Show the Rg of the three best conformations. (O) The inhibitory effects of kaempferol on SARS‐CoV‐2 in Vero E6 cells [Colour figure can be viewed at wileyonlinelibrary.com]
