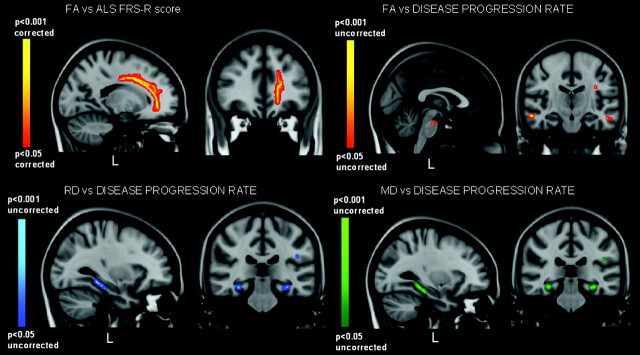
Fig 3.
GLM correlation analyses of FA, RD, and MD measures with ALSFRS-R and disease progression-rate values. A positive correlation between FA and ALSFRS-R is revealed in the WM underneath the left premotor cortex (especially the paracentral lobule and cingulate gyrus) (P < .05, corrected) (top left), while an inverse correlation is identified between FA and the disease-progression rate within the CSTs (pons) and frontotemporal WM (middle temporal and left inferior frontal gyri) (P < .01, uncorrected) (top right). Additionally, positive correlations are identified with both RD (low left) and MD (low right) measures in the hippocampus and within the inferior longitudinal fasciculus (P < .01, uncorrected).

