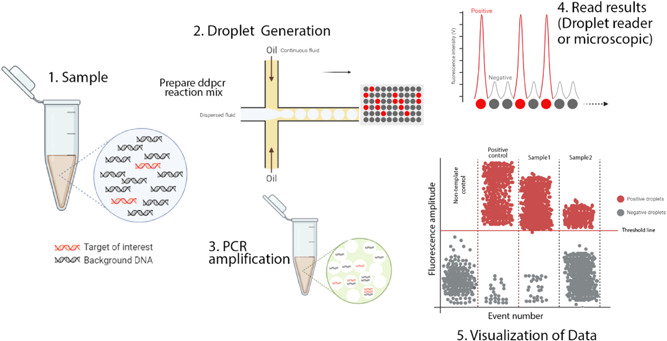
Figure 1.

Schematic illustration of ddPCR. This figure illustrates the digital PCR droplet principle and how a single sample containing the target sequence is partitioned. PCR amplified produces thousands of copies that can be detected and interpreted by a detection system. In a typical ddPCR workflow, a single sample includes target and nonspecific sequences (DNA or RNA), real‐time PCR primers and fluorescent‐labeled probes, and standard real‐time PCR master mixes. 1 A sample partitioned into thousands of single nanoliter droplets with the generation of water‐in‐oil emulsions. A proportion of droplets contain no template molecules, while others contain one or more targets. The generation of droplets from the sample is achieved in several ways. Standard methods include T‐junction and flow‐focusing geometry. Only the flow‐focusing geometry is shown here. For more details, see the text. 2 traditional end‐point PCR is then performed to amplify the target sequence. 3 Target sequence droplets exhibit higher fluorescence intensity and are known to be positive droplets. Empty or no targets show low and negative fluorescent intensity. This fluorescence intensity versus time is plotted on a graph. The number of targets per partition will follow the normal Poisson distribution encapsulation of the DNA or RNA that occurs randomly. Various methods can interpret the fluorescent intensity of droplets. The most popular of these is a fluorescent microscope or a droplet reader. 4 The acquired data is visualized in a graph by different software. The threshold value indicates the intensity of fluorescence as the positive particles are separated from the negative. Although this value is set automatically by the software, it can be adjusted manually. ddPCR, droplet‐based digital PCR
