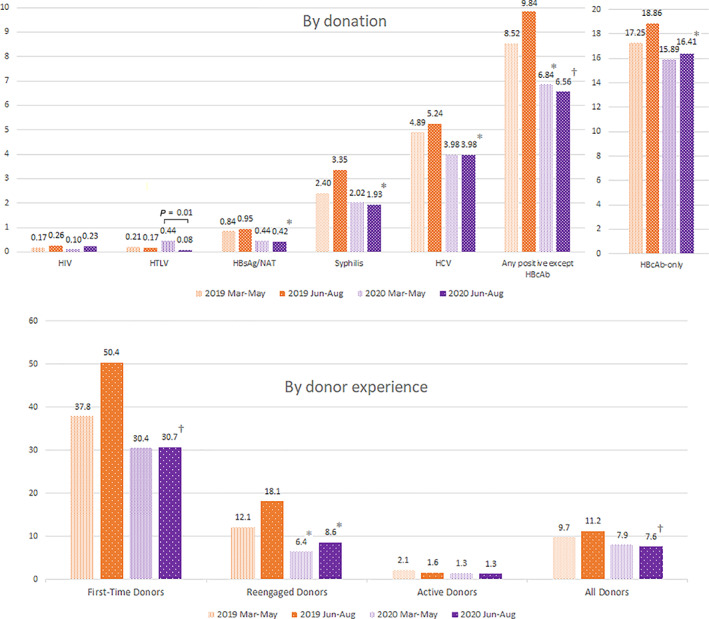
FIGURE 1.

IDM confirmed reactivity rates by donation and by donor (per 10,000), March–August 2019 and 2020 (*p < .05 compared with same period 2019; †p < .0001 compared with same period 2019; there were no significant differences between Mar‐May 2020 and Jun‐Aug 2020 for any group except by‐donation HTLV testing) [Color figure can be viewed at wileyonlinelibrary.com]
