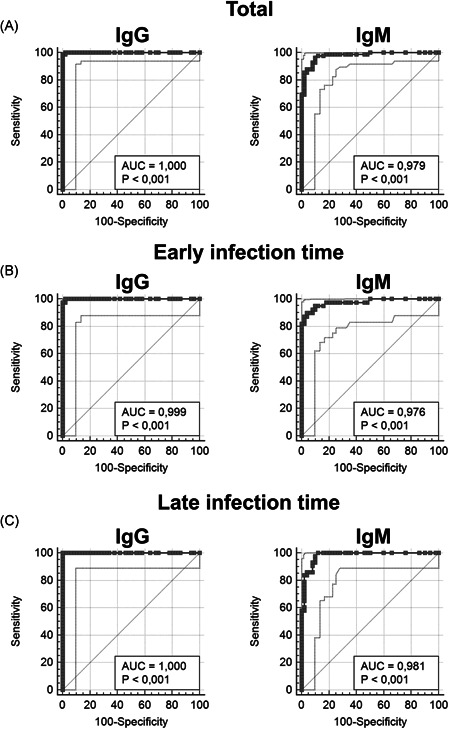
Figure 2.

Anti‐SARS‐CoV‐2 IgG and IgM ROC curves results. Total patient group data are shown in Panel A (area under curve [AUC] 1.0 and 0.979, respectively); early infection time group data are shown in Panel B (AUC 0.999 and 0.976, respectively); late infection time group data are shown in Panel C (AUC 1 and 0.981, respectively). IgG, immunoglobulin G; IgM, immunoglobulin M; ROC, receiver operating characteristic; SARS‐CoV‐2, severe acute respiratory syndrome coronavirus 2
