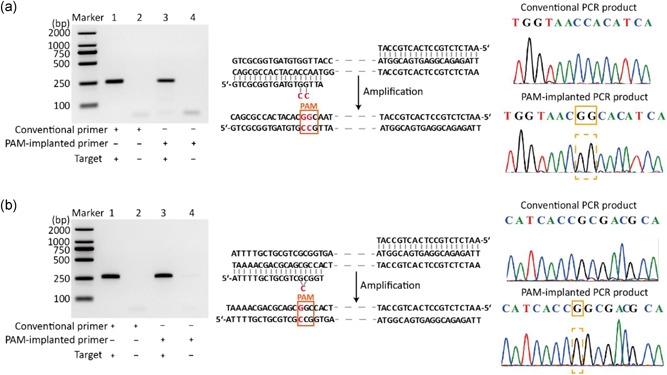
Figure 4.

Verification of PAM‐implanted PCR. (a) On the left is the agarose gel analysis of products from conventional PCR and PAM‐implanted PCR which contain primers implanted by two C bases. In the middle is the schematic diagram of primer modification and amplification products. On the right is the sequencing result of products from conventional PCR (top) and PAM‐implanted PCR (bottom). (b) On the left is the agarose gel analysis of products from conventional PCR and PAM‐implanted PCR which contain primers implanted by single C base. In the middle is the schematic diagram of primer modification and amplification products. On the right is the sequencing result of products from conventional PCR (top) and PAM‐implanted PCR (bottom). PAM, protospacer adjacent motif; PCR, polymerase chain reaction [Color figure can be viewed at wileyonlinelibrary.com]
