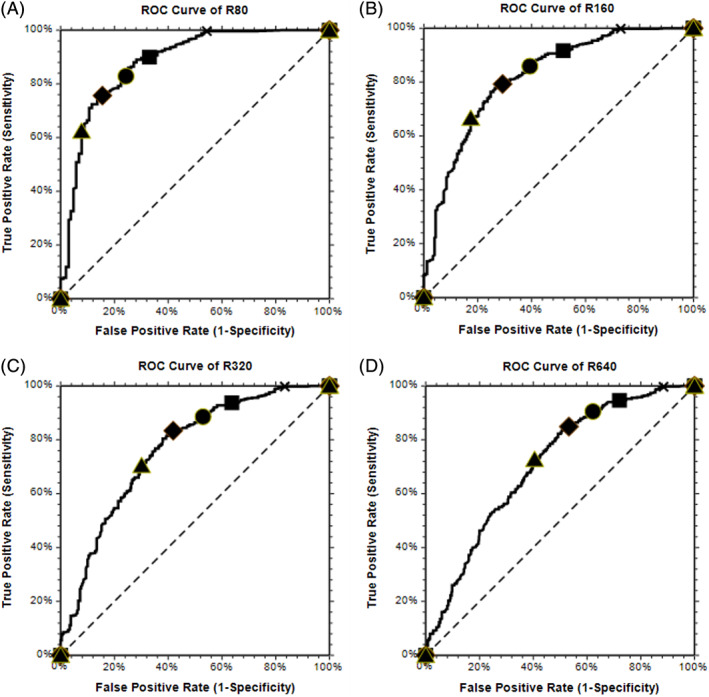
FIGURE 3.

ROC curves for varied nAb titer thresholds. As the nAb titer increases, the ability of the S/Co to predict the nAb titer decreases. ▲:S/Co= 60 ♦:S/Co= 30 ●:S/Co= 20 ■:S/Co= 10 X:S/Co= 1 [Color figure can be viewed at wileyonlinelibrary.com]
