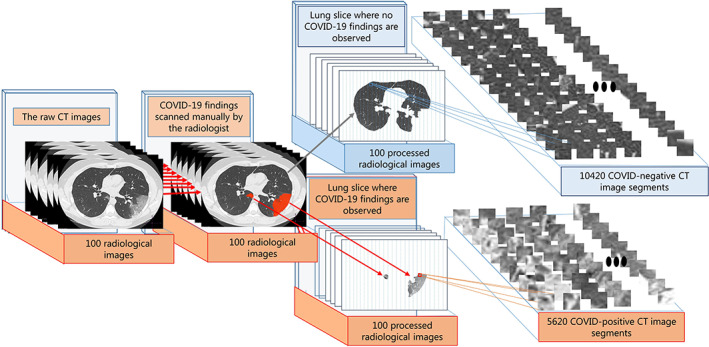
FIGURE 3.

The segmentation process of computed tomography (CT) images diagnosed with COVID‐19 pneumonia: Scanned regions related to lesions on 1200 × 800 CT images (COVID‐positive), obtaining 28 × 28 sub‐CT images for other regions (COVID‐negative) without any findings of lesions [Color figure can be viewed at wileyonlinelibrary.com]
