FIGURE 6.

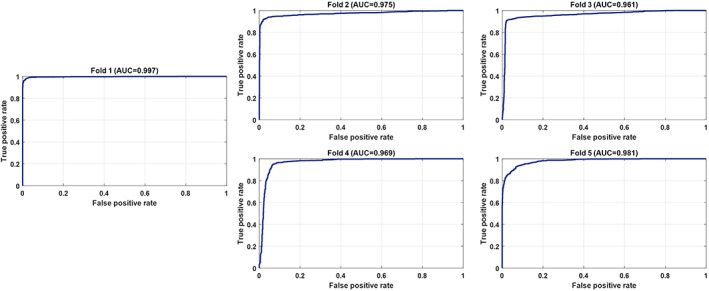
The ROC curves and area under the ROC curve (AUC) values for each fold related to a balanced distribution [Color figure can be viewed at wileyonlinelibrary.com]

The ROC curves and area under the ROC curve (AUC) values for each fold related to a balanced distribution [Color figure can be viewed at wileyonlinelibrary.com]