
FIGURE 3.
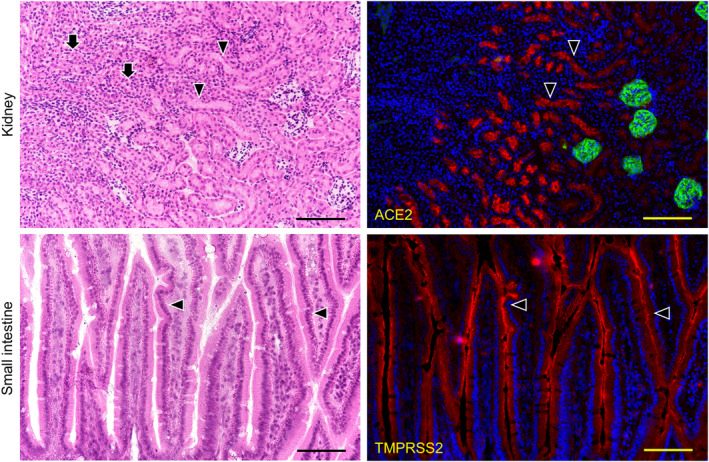
Immunostaining for ACE2 and TMPRSS2 of the mouse kidney and small intestine. HE staining (left panels) and immunostaining (right panels) for ACE2 (red), and for podoplanin (green) with DAPI staining of nuclei (blue). In the mouse kidneys (top panels), the reaction with anti‐ACE2 (arrowheads) was only observed in the proximal tubular cells with brush border (HE), but no other region including the distal tubular cells (HE, arrows) reacted with anti‐ACE2. It is possible to discriminate glomeruli stained with anti‐podoplanin. In the sections of mouse small intestine (bottom panels), the reaction with anti‐TMPRSS2 (red, arrowheads) was only observed in the monolayered columnar epithelial cells of the small intestine (HE), but no other region including the lamina propria mucosae (HE, arrows) reacted with anti‐TMPRSS2. Bar: 100 μm