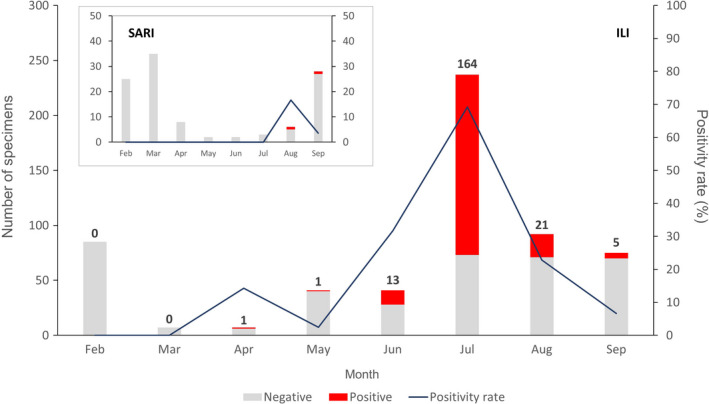
FIGURE 4.

Monthly laboratory results from the Severe Acute Surveillance Infection (SARI) and Influenza‐Like Illness (ILI) surveillance in Madagascar from February to September 2020. Each bar represents the total number of negative cases (grey) and SARS‐CoV‐2–positive cases (red). Numbers above bars indicate the number of positives. The dark blue line represents the positivity rate
