Figure 3.

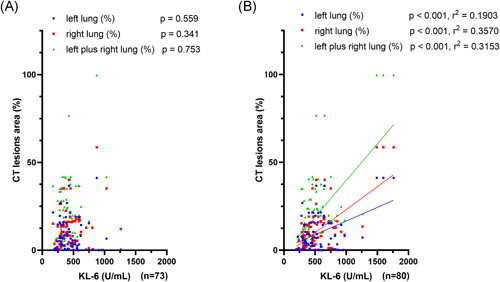
Linear correlations between computed tomography (CT) lung lesions areas and the Krebs von den Lungen‐6 (KL‐6) values within the previous week (A) (n = 73) and within the next week (B) (n = 80)

Linear correlations between computed tomography (CT) lung lesions areas and the Krebs von den Lungen‐6 (KL‐6) values within the previous week (A) (n = 73) and within the next week (B) (n = 80)