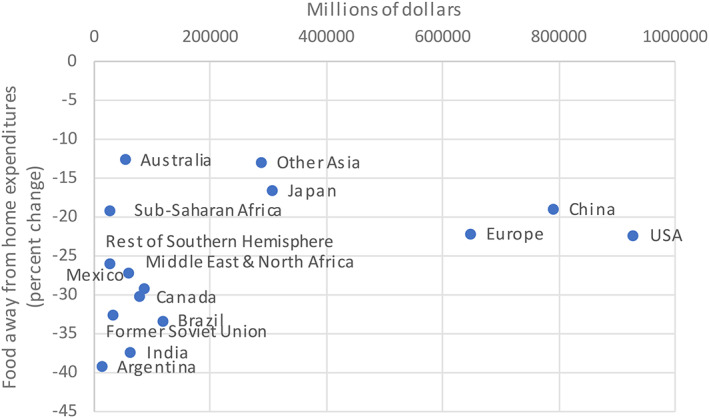
Figure 2.

Expenditures for food away from home in 2020 compared to 2019 Note: This figure illustrates the percentage change in food away from home expenditures across regions in 2020 compared to 2019. The values are imposed as exogenous shocks in the CGE model to account for region‐specific changes in food away from home spending. There are no data available for the Central America & Caribbean region, as such we use an average of Latin America countries. Source: Euromonitor (2021)
