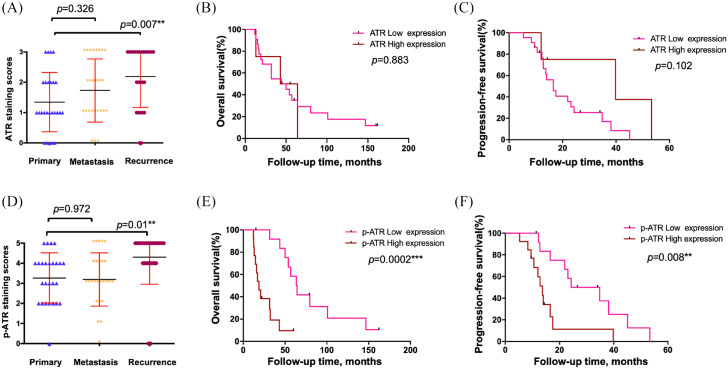
Figure 3.
Higher levels of ATR and p-ATR were present in recurrent ovarian cancer tissues compared with patient-matched primary tumors, and strong p-ATR expression correlated with poor patient prognosis. (A) ATR staining scores among tissues taken from primary, synchronous metastatic, and metachronous recurrent tumors. (B, C) Correlation between ATR expression in the primary ovarian cancer tissues and OS (B) or PFS (C) in ovarian cancer patients by Kaplan–Meier survival analysis. (D). p-ATR staining scores distribution among the same tumor samples. (E, F) Relationship between p-ATR expression in the primary ovarian cancer tissues and OS (E) or PFS (F) in ovarian cancer patients by Kaplan–Meier survival analysis.
ATR, ataxia-telangiectasia and Rad3 related; OS, overall survival; p-ATR, phospho-ATR ser428; PFS, progression-free survival.

