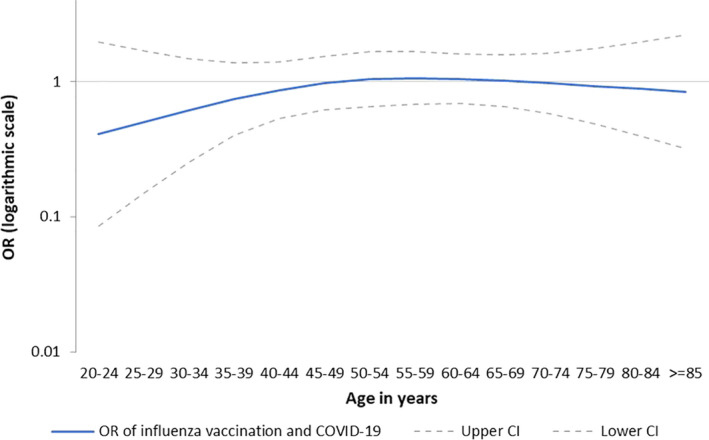
FIGURE 3.

Adjusted odds ratio by 5‐y age group (y‐axis on logarithmic scale), I‐MOVE‐COVID‐19 primary care study, primary analysis (FR, NL and SE), Europe, March‐August 2020. CI, confidence intervals; FR, France; NL, The Netherlands; OR, odds ratio; SE, Sweden
