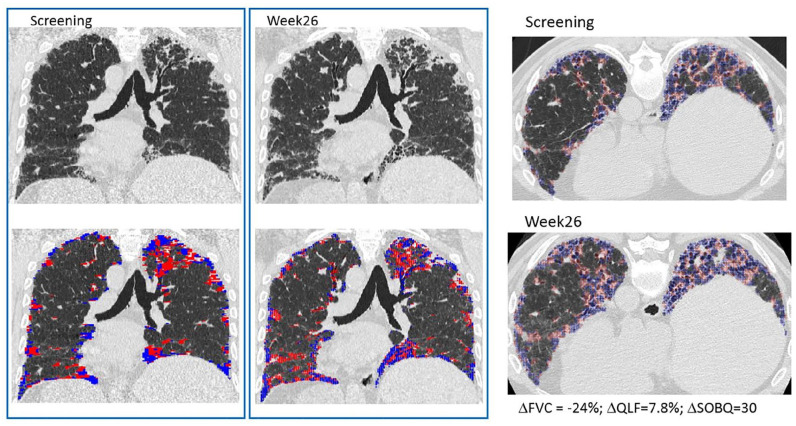
Figure 3.
Representative coronal and axial HRCT images from a patient in the placebo arm at screening and week 26. Change over 26 weeks: FVC: −24%; QLF score: 7.8%; UCSD-SOBQ: 30.
Classification overlay for QLF score is in blue and red.
FVC, forced vital capacity; HRCT, high resolution computed tomography; QLF, quantitative lung fibrosis; UCSD-SOBQ, University of California San Diego Shortness of Breath Questionnaire.

