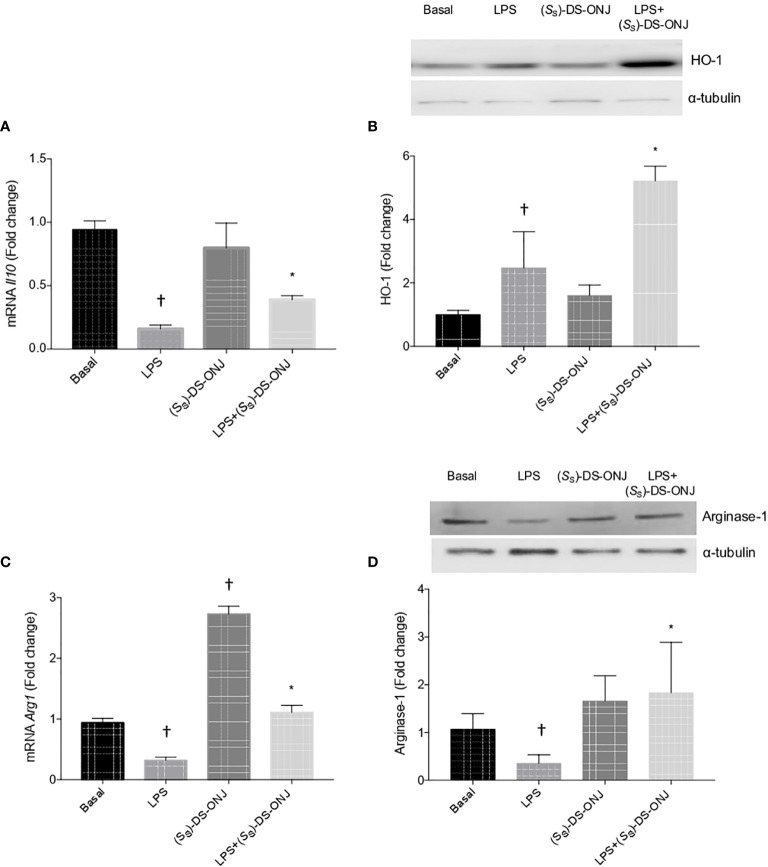
Figure 5.
The anti-inflammatory response mediated by HO-1 and IL-10. Bv.2 microglial cells were stimulated with 200 ng/mL LPS in the presence, or absence, of 10 μM (S S)-DS-ONJ for 24 h. (A) Il10 mRNA determined by qRT-PCR. (B) Protein extracts were analyzed by Western blot with antibodies against HO-1 and α-tubulin (loading control). Representative autoradiograms are shown. Blots were quantified using scanning densitometry. (C) Arg1 mRNA determined by qRT-PCR. The results are presented as means ± SEM. (D) Protein extracts were analyzed using Western blot, with antibodies against Arginase-1; α-tubulin was a loading control. Representative autoradiograms are presented. Blots were quantified using scanning densitometry. The results are presented as means ± SEM. Fold changes are relative to the basal values. *p ≤ 0.05 vs LPS treatment, †p ≤ 0.05 vs the basal values (two-way ANOVA followed by Bonferroni t-test).

