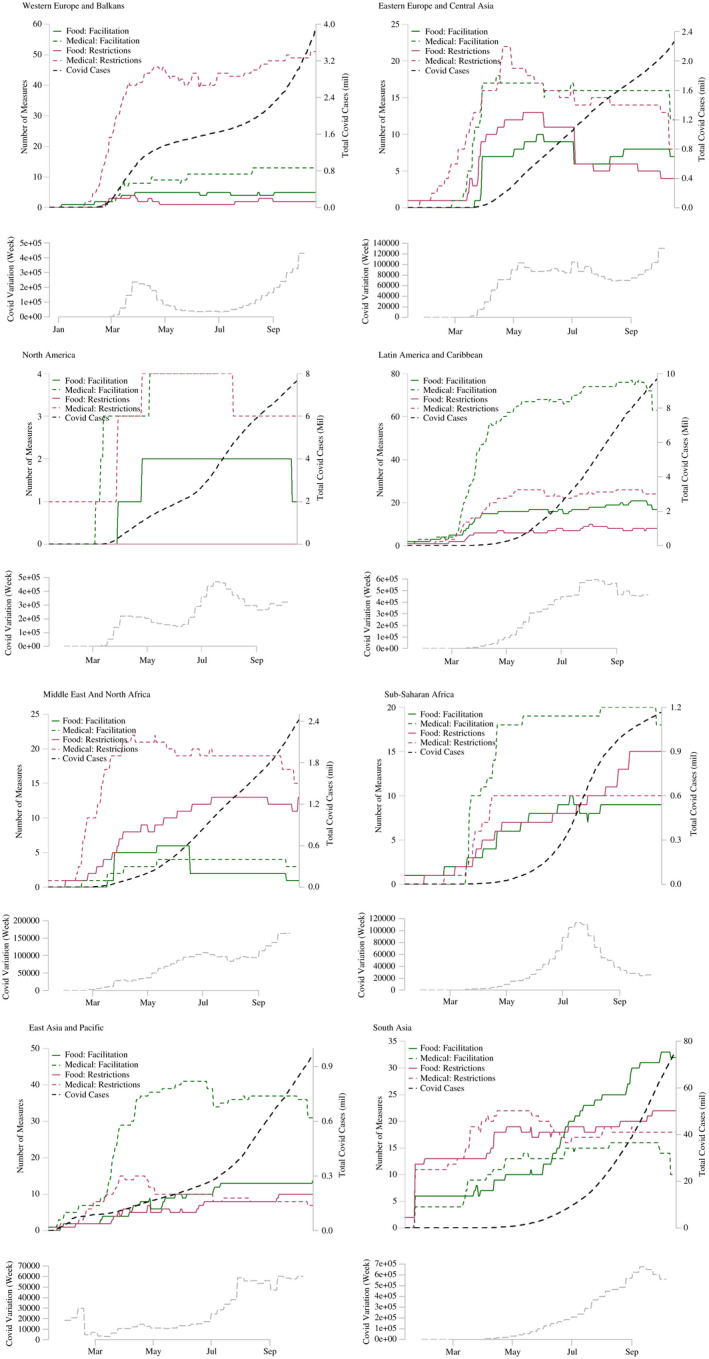
FIGURE A1.

World and regional aggregate trade policy responses and COVID‐19 cases.
Notes: For each regional sub‐figure the upper part plots the number of active trade policy measures and the absolute number of COVID‐19 cases over time while the lower part plots the weekly variation of COVID‐19 cases.
