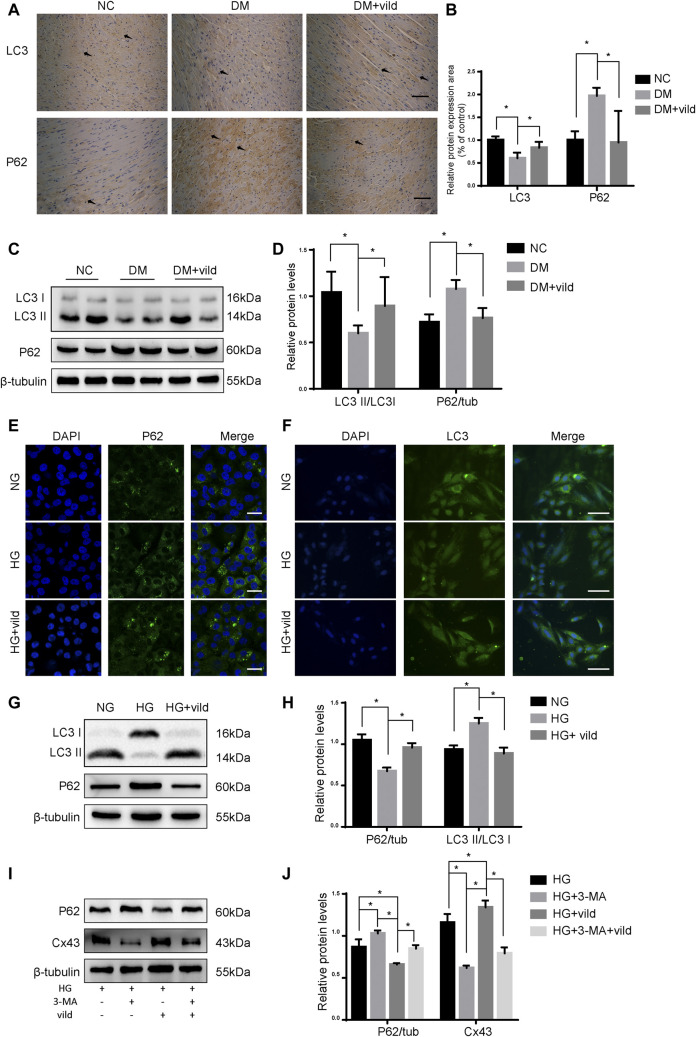
FIGURE 2.
Vild treatment restores autophagy in vivo and in vitro. (A) Immunohistochemical staining of P62 and LC3 in cardiac sections. Scale bars in the right lower corner represent 20 μm. (B) Immunochemistry analysis of LC3 and P62. (C) Representative WB images of P62 and LC3. (D) Quantification of P62 and LC3 protein levels. (E) Immunofluorescence staining of P62 in H9c2 cells. Scale bars in the right lower corner represent 5 μm. (F) Immunofluorescence staining of P62 and LC3 in HMCs. Scale bars in the right lower corner represent 50 mm (G) Representative WB images of P62 and LC3 in H9c2 cells. (H) Quantification of P62 and LC3 protein levels. *p < 0.05. (I) Representative western blotting images of P62 and Cx43. (J) Quantification of P62 and Cx43 protein levels.

