
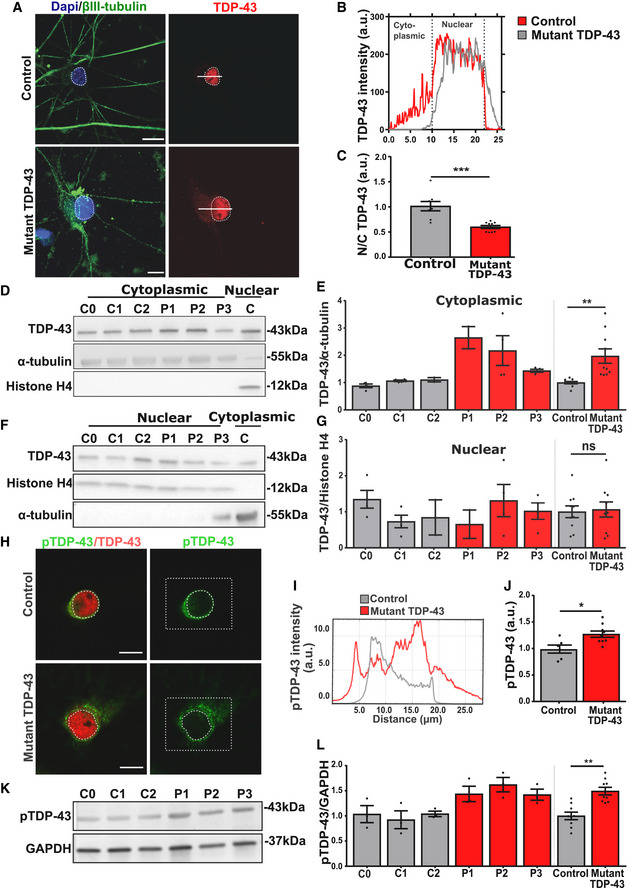
Figure 2. Mutant TDP‐43 motor neurons exhibit TDP‐43 cytoplasmic mislocalization and increased phosphorylation.
-
AImmunofluorescent analysis of TDP‐43 in control and mutant TDP‐43 iPSC‐derived motor neurons. Upper images represent control and lower mutant TDP‐43 motor neurons. Presented immunofluorescent images of control (C2) and mutant TDP‐43 (P2), Scale bar: 20 µm.
-
BCorresponding profile intensity plot of panel A.
-
CQuantification of the nucleo‐cytoplasmic ratio (N/C) of TDP‐43 fluorescent intensity of pooled control and pooled mutant motor neurons, unpaired Mann–Whitney test.
-
D, E(D) Western blot analysis of cytoplasmic fraction with a positive nuclear control (C) confirming the fractionation purity, quantification in (E), ratio paired t‐test.
-
F, G(F) Western blot analysis of nuclear fraction with a positive cytoplasmic control (C) confirming the fractionation purity, quantification in (G), ratio paired t‐test.
-
H–JImmunofluorescent analysis showing fluorescence intensity of phosphorylated TDP‐43 (pTDP‐43). Scale bar: 20 µm. Presented immunofluorescent images of control (C2) and mutant TDP‐43 (P2). (I) represents its corresponding profile intensity plot of the selected (square) region. Scale bar: 10 µm. (J) quantification pooled control (C0 = 10, C1 = 10, and C2 = 10) n = 30 and pooled mutant TDP‐43 (P1 = 10, P2 = 10, and P3 = 10) n = 30 cells from each differentiation. Unpaired Mann–Whitney test.
-
K, L(K) Western blot analysis showing pTDP‐43, quantification in (L), ratio paired t‐test.
Data information: Data are shown as mean ± SEM, *P < 0.05, **P < 0.01, ***P < 0.001, ns: not significant. Each dot represents an independent differentiation in all panels: Data obtained from three independent differentiations.