
Figure 4. Mutant TDP‐43 motor neurons display mitochondrial transport defects.
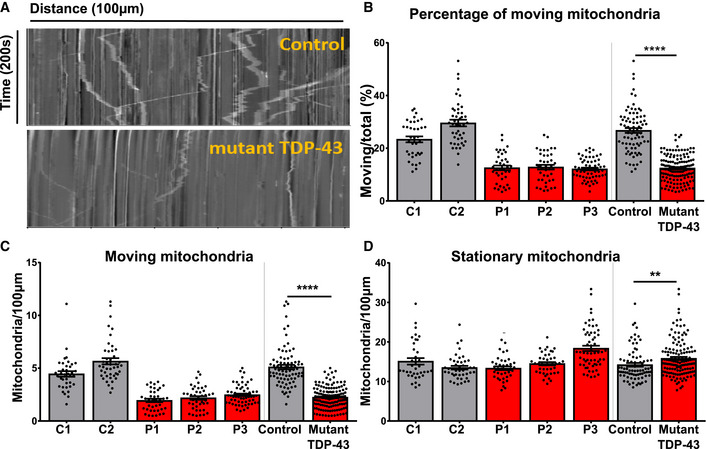
- Representative kymographs from control and mutant TDP‐43 iPSC‐derived motor neurons. The x‐axis represents distance in µm while on the y‐axis time in seconds is revealed. Stationary mitochondria are visible as straight vertical lines, while moving mitochondria are depicted as skewed lines.
- Quantification of percentage of moving mitochondria.
- Quantification of the absolute number of moving mitochondria.
- Quantification of stationary mitochondria normalized to neurite length 100 µm.
Data information: Data are shown as mean ± SEM, **P < 0.01, ****P < 0.0001. For panels (B, C, and D): Each dot represents one neurite for control (n = 81) and mutant TDP‐43 (n = 141) neurites. Mann–Whitney test in all panels. Data combined from three independent differentiations.