
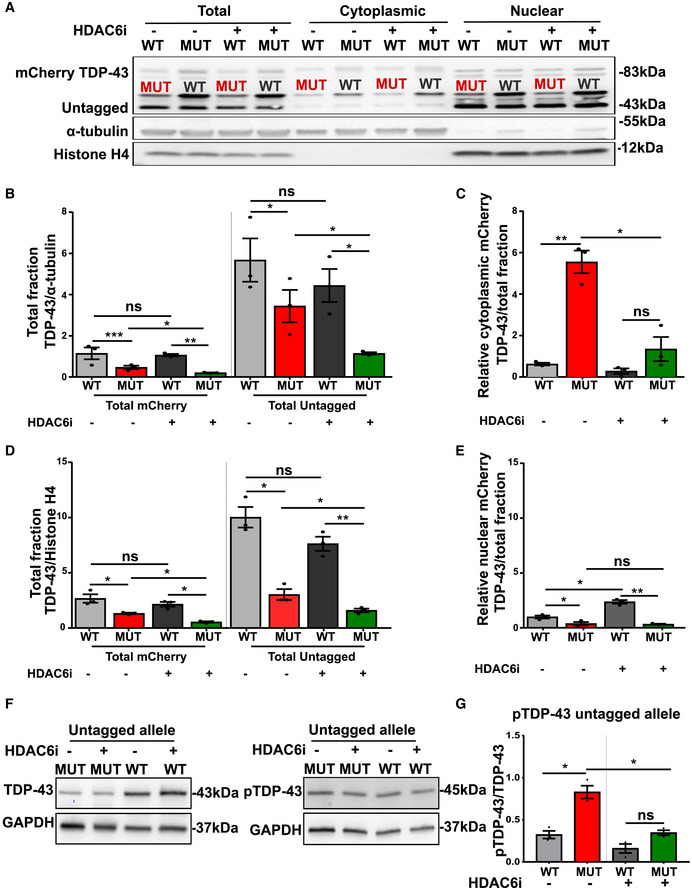
Figure 9. HDAC6 inhibitor reduces cytoplasmic MUT‐mCherry TDP‐43 and enhances nuclear WT‐mCherry TDP‐43.
-
ARepresentative Western blot of total (mCherry and untagged), cytoplasmic TDP‐43 and nuclear levels with and without HDAC6 inhibitor.
-
BQuantification of total mCherry and total untagged relative to α‐tubulin, ratio paired t‐test.
-
CQuantification of relative cytoplasmic mCherry TDP‐43 on total fraction, ratio paired t‐test.
-
DQuantification of total mCherry and total untagged relative to Histone H4, ratio paired t‐test.
-
EQuantification of relative nuclear mCherry TDP‐43 on total fraction, ratio paired t‐test.
-
F, G(F) Western blot showing untagged TDP‐43 (left panel) and phosphorylation state of the untagged allele (right panel) in WT‐ and MUT‐mCherry motor neurons and in (G) ratio quantification of normalized pTDP43/normalized TDP‐43 (because of almost the same molecular weight two different blots were used), ratio paired t‐test.
Data information: Data are shown as mean ± SEM, *P < 0.05, **P < 0.01, ***P < 0.001, ns: not significant. Each dot represents an independent differentiation in all panels: Data combined from three independent differentiations.