
Figure 2. Sgo2 localized by Mps1 to the chromatid junction is dispensable for sister chromatid segregation.
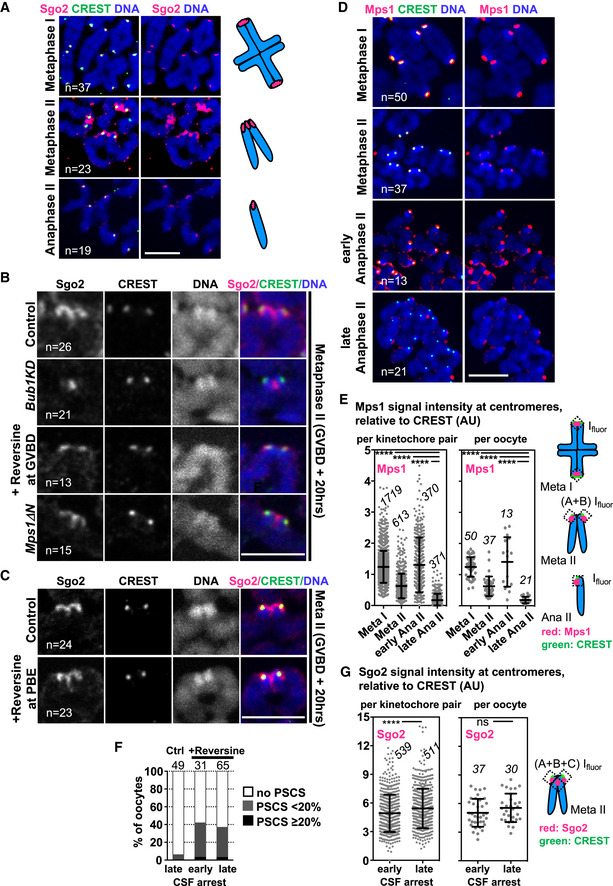
- Chromosome spreads at the indicated stages of meiosis, stained for endogenous Sgo2 (pink), centromeres with CREST serum (green) and DNA with Hoechst (blue). On the right, schemes illustrate the chromosome figures observed, and the corresponding Sgo2 staining (in pink).
- Dyads of metaphase II chromosome spreads of control, Bub1KD, Mps1ΔN and Reversine‐treated oocytes (from GVBD onwards) stained with Sgo2 antibody (pink), CREST serum (green) and Hoechst (blue).
- Dyads of metaphase II chromosome spreads of oocytes treated with Reversine from GVBD + 8 h onwards, corresponding to the time of anaphase I onset. PBE: polar body extrusion, stainings as in (B).
- Chromosome spreads at the indicated stages of meiosis, stained for endogenous Mps1 (pink), centromeres with CREST serum (green) and DNA with Hoechst (blue). For early and late anaphase II spreads, oocytes were chemically activated with Strontium and fixed 25 min or 1 h later, respectively.
- Quantification of (D) showing Mps1 signal relative to CREST per kinetochore pair (per single kinetochore in anaphase II) (left dot plot), and Mps1 signal averaged per oocyte (right dot plot) at the indicated timepoints. The number of kinetochore pairs (kinetochores in anaphase II) and oocytes analyzed is indicated. The scheme of measurements is shown on the right.
- Percentage of oocytes harboring one or more single sister chromatids when analyzed by chromosome spreads stained with CREST and Hoechst. Where indicated, oocytes were treated with Reversine from GVBD onwards, and treatment was renewed every 8 h. Early CSF corresponds to 8 h after GVBD (Reversine‐treated oocytes undergo anaphase I on average 4–5 h after GVBD), and late CSF corresponds to 36 h after GVBD (> 29 h in CSF arrest). PSCS, precocious sister chromatid segregation.
- Quantification of total Sgo2 signal on spreads in early or late CSF arrest (16 h or 30 h after GVBD, respectively) relative to CREST per kinetochore pair (per single kinetochore in anaphase II) (left dot plot), and Sgo2 signal averaged per oocyte (right dot plot) at the indicated stages. The number of kinetochore pairs and oocytes analyzed is indicated. The scheme of measurements is shown on the right. Meta: metaphase and ana: anaphase.
Data information: On each graph mean is indicated, error bars are ± SD, asterisks indicate significant difference (****P < 0.0001; ns = not significant) according to Mann–Whitney U‐test. AU, arbitrary units, n indicates number of analyzed kinetochores, kinetochore pairs or oocytes, as indicated. Scale bars, 10 μm. See also Fig EV2.