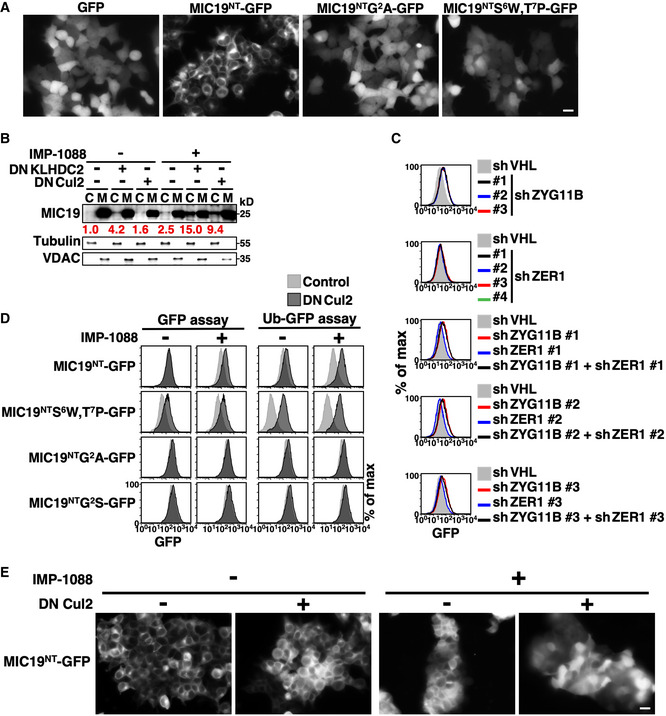
Figure EV3. MIC19 bears both N‐ and C‐degrons.

- Live‐cell images of 293T cells stably expressing GFP or GFP N‐terminally tagged with the wild‐type or mutant N‐terminal motif of MIC19 (aa. 1–24). Scale bar = 20 µm.
- Fractionation and Western blot analysis of endogenous MIC19 in U2OS cells with or without DNKLHDC2 or DNCul2 treatments. C and M denote cytosol and mitochondrial fractions, respectively. Tubulin and VDAC serve as fractionation quality controls. The relative abundance of cytosolic MIC19/tubulin was normalized to that of lane 1 and is indicated under each lane in red.
- Abundance analysis of MIC19NT‐GFP in cells treated with multiple shRNAs against ZYG11B, ZER1 or both. ZYG11B and ZER1 are BC‐box proteins involved in Gly/N‐degron recognition (Timms et al, 2019).
- Abundance analysis of MIC19NT‐GFP fusion proteins with (right) or without (left) a N‐terminal ubiquitin. The ubiquitin fusion technique is commonly used to characterize N‐degrons. Proteolytic cleavage of the ubiquitin moiety by Dubs resulted in exposure of MIC19NT.
- Live‐cell images of MIC19NT‐GFP in 293T cells with or without DNCul2 and IMP‐1088 treatments. IMP‐1088 treatment led to aggregations of 293T cells. Scale bar = 20 µm.
Source data are available online for this figure.
