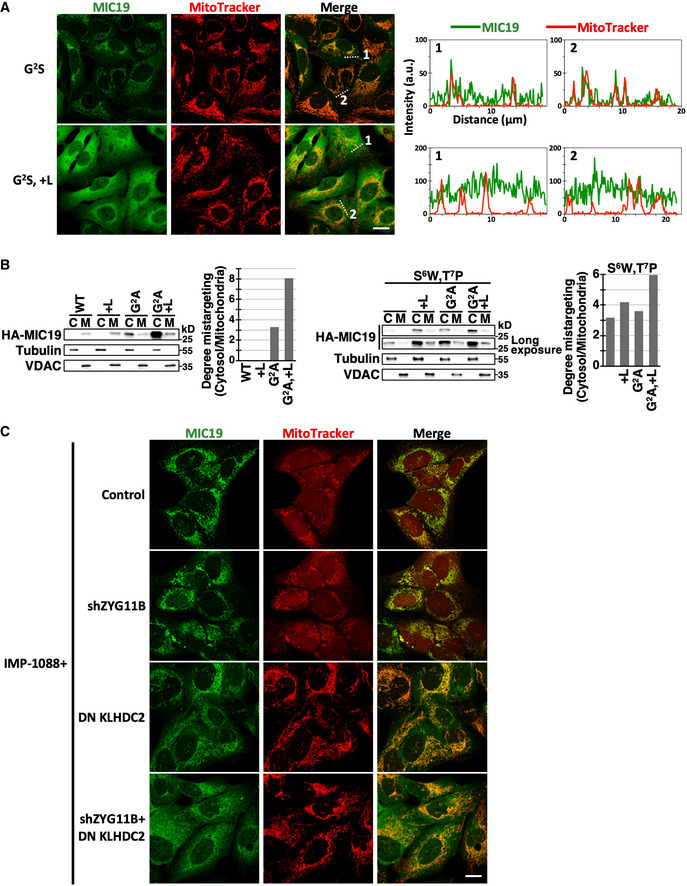
Figure EV4. Mitochondrial localization of MIC19 is doubly assured by N‐degron and C‐degron pathways.

- Confocal immunofluorescence images of indicated HA‐tagged MIC19 variants and MitoTracker staining in U2OS cells. The fluorescence intensities along the dashed lines are shown as line profile graphs on the right. Scale bar = 20 µm.
- Fractionation analysis of HA‐tagged MIC19 variants in U2OS cells. The relative abundance of cytosolic to mitochondrial HA‐MIC19 is quantified and shown on right.
- Confocal immunofluorescence images of wild‐type HA‐MIC19 and MitoTracker staining in U2OS cells treated with IMP‐1088 and with or without inhibition of ZYG11B or KLHDC2. Scale bar = 20 µm.
