FIGURE 3.

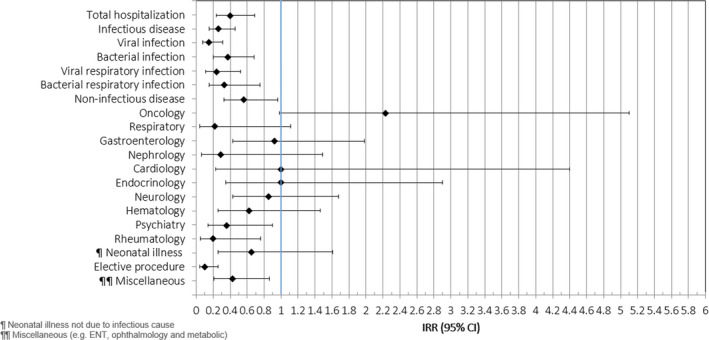
Forest plot showing the incidence rate ratios of the different reasons for hospitalisations between the COVID‐19 study period and the corresponding period in 2019

Forest plot showing the incidence rate ratios of the different reasons for hospitalisations between the COVID‐19 study period and the corresponding period in 2019