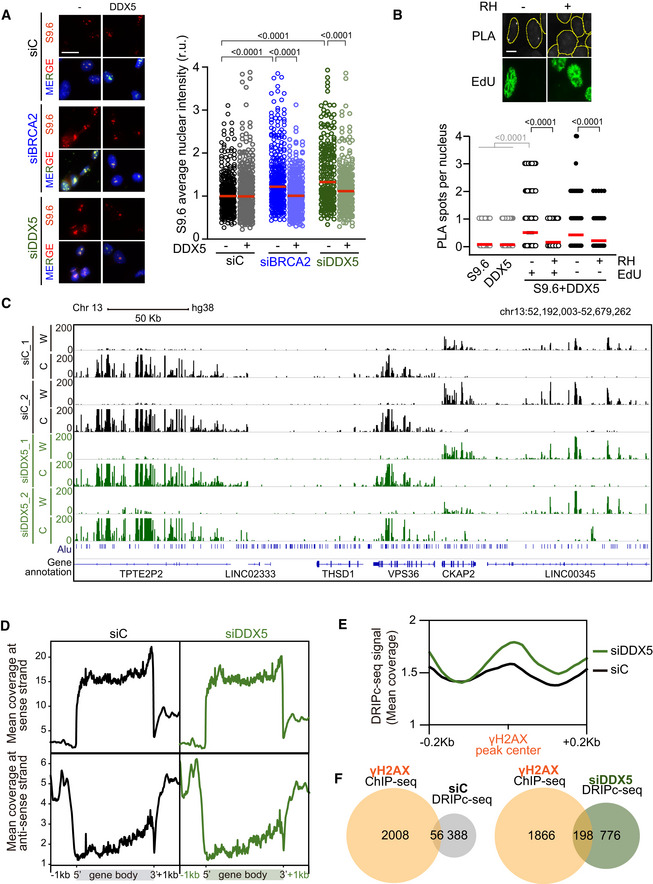
Figure 2. DDX5 depletion leads to a genome‐wide accumulation of DNA‐RNA hybrids particularly enriched at DSBs.

- Left: Representative images of S9.6 immunofluorescence of U2OS cells depleted of BRCA2 (siBRCA2), DDX5 (siDDX5), or control cells (siC) after transfection with either an empty plasmid or a plasmid expressing DDX5. The merged images show the signal of S9.6, nucleolin (nucleoli) antibodies and DAPI staining. Scale bar indicates 25 µm. Right: Quantification of S9.6 average nuclear intensity of U2OS cells depleted of BRCA2 (siBRCA2), DDX5 (siDDX5), or control cells (siC) after transfection with either an empty plasmid or a plasmid expressing DDX5. The red line in the plot indicates the median, and each symbol represents the value of a single cell. The statistical significance of the difference was calculated with Mann–Whitney U‐test, and the P‐values show the significant difference. The data represent at least 235 cells per condition from three independent experiments. See also Fig EV2B.
- Top: Representative images of in situ PLA performed with anti‐DDX5 and S9.6 antibodies in EdU‐labeled U2OS cells. Where indicated, cells were transfected with a plasmid expressing RNase H1 (RH). Nuclei as defined by auto threshold plugin on the DAPI image (ImageJ) are outlined in yellow. Bottom: Quantification of PLA spots per nucleus in each condition as indicated. At least 300 cells per condition were counted from three independent experiments. For statistical comparison of the differences between the samples, we applied a Kruskal–Wallis test followed by Dunn’s multiple comparison test and the P‐values show significant differences. The red line in the plot indicates the median, and each symbol represents a single PLA spot. See also Fig EV2C.
- Representative screenshot of a specific genomic region showing DRIPc‐seq profiles at Watson (W) and Crick (C) strands in K562 cells depleted of DDX5 (siDDX5) or control cells (siC) from two independent experiments. See also Fig EV3.
- DNA‐RNA hybrid distribution along protein‐coding genes containing DRIPc‐seq peaks in both conditions (siC and siDDX5) and replicates. Gene metaplots represent the mean of antisense or sense DRIPc‐seq signal from two independent experiments in K562 cells depleted of DDX5 (siDDX5) or control cells (siC) as indicated.
- DNA‐RNA hybrid metaplot distribution over γH2AX ChIP‐seq peaks. Peak metaplot shows the mean DRIPc‐seq signal from two independent experiments in K562 cells depleted of DDX5 (siDDX5) or control cells (siC).
- Venn diagram representing the overlap between γH2AX‐positive genes in K562 cells (γH2AX ChIP‐seq) and genes that specifically accumulate hybrids in control cells (top) or in DDX5‐depleted cells (bottom).
