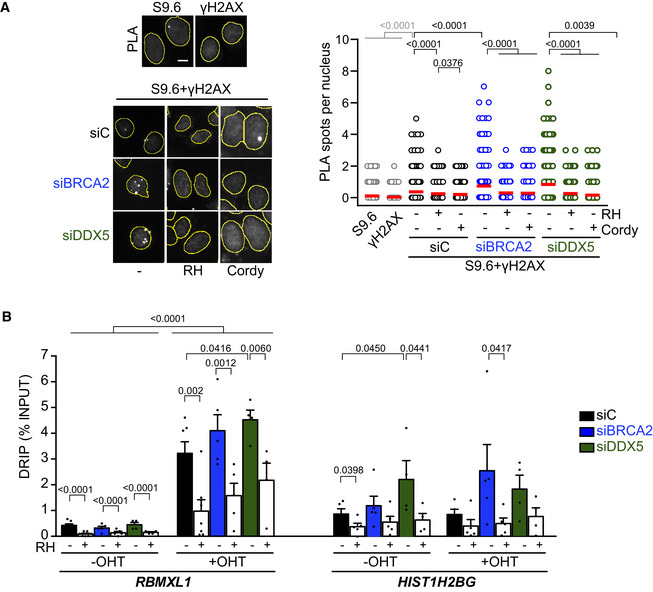
Left: Representative images of
in situ PLA between S9.6 and γH2AX antibodies in U2OS cells depleted of BRCA2 (siBRCA2), DDX5 (siDDX5), or control cells (siC). When indicated, cells were transfected with a plasmid expressing RNase H1 (RH) 24 h before or treated with cordycepin (Cordy) for 2 h at 37°C before fixation. Single antibody controls from non‐irradiated siC cells are shown. Scale bar indicates 10 µm. Nuclei as defined by auto threshold plugin on the DAPI image (ImageJ) are outlined in yellow. Right: Quantification of PLA spots per nucleus in each condition as indicated. At least 500 cells per condition were counted from three independent experiments. For statistical comparison of the differences between the samples, we applied a Kruskal–Wallis test followed by Dunn’s multiple comparison test and the
P‐values show significant differences. The red line in the plot indicates the median, and each symbol represents a single PLA spot. See also Fig
EV4A.

