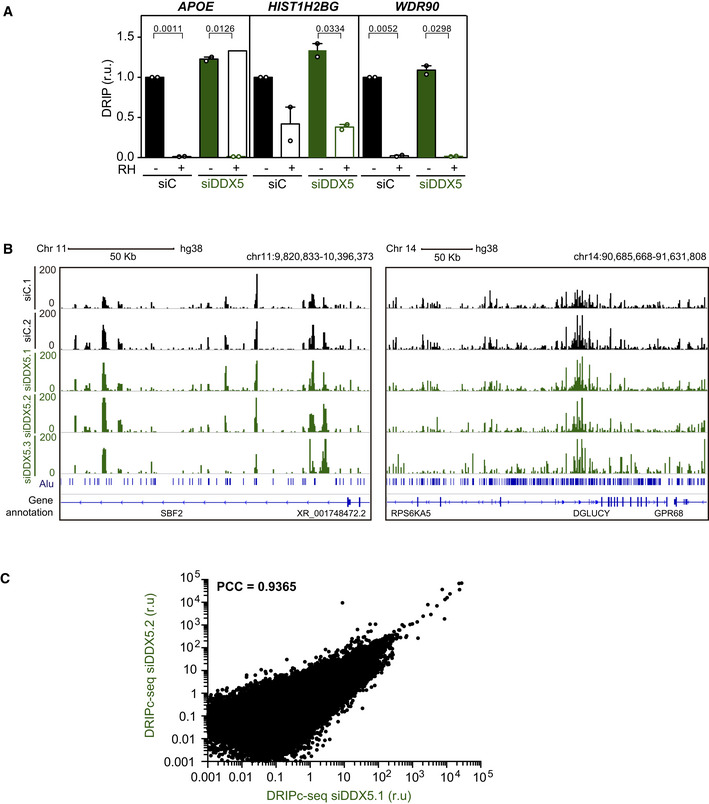
Figure EV3. Related to Fig 2. Reproducibility of the DRIPc‐seq data.

- Relative DRIP‐qPCR signal values (respect to the siC level at each locus) at the APOE, HIST1H2BG, and WDR90 loci in K562 cells transfected with the indicated siRNAs and treated in vitro with RNase H1 (RH) pre‐immunoprecipitation where indicated. The data represent the mean ± SEM from two independent experiments. The statistical significance of the difference was calculated with paired Student t‐test, and the P‐values show the significant difference.
- Representative screenshots of specific genomic regions showing the DRIPc‐seq profiles without DNA strand separation in K562 cells depleted of DDX5 (siDDX5) from three independent experiments as compared to data from control cells (siC). Two regions with different Alu sequence density are shown for comparison.
- xy correlation plot between the DRIPc signal intensity from two DRIPc‐seq independent experiments performed in DDX5‐depleted K562 cells (PCC, Pearson correlation coefficient).
