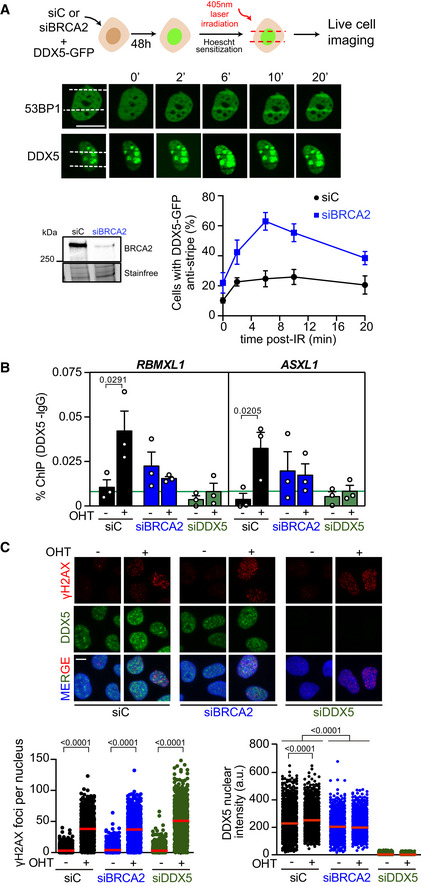
Figure 4. BRCA2 enhances DDX5 retention at DNA damage sites.

- Top: Scheme showing the experimental set up for laser irradiation in DDX5‐GFP transfected U2OS cells depleted of BRCA2 (siBRCA2) or control cells (siC). Middle: Live cell imaging of the recruitment of GFP‐53BP1 or DDX5‐GFP to DNA damage tracks at different time points as indicated. Exposure and processing were adjusted to best demonstrate stripes and anti‐stripes. Scale bar indicates 10 µm. Bottom left: Western blot showing the siRNA‐mediated knock‐down of BRCA2 from U2OS cells transfected with DDX5‐GFP. Bottom right: Quantification of the percentage of transfected cells that exhibit DDX5‐GFP “anti‐stripe” pattern (reduced GFP signal at DNA damage tracks compared to the signal in the nucleus) at the times indicated in cells depleted of BRCA2 (siBRCA2) or treated with control siRNA (siC). The data represent the mean ± SEM from three independent experiments.
- DDX5 ChIP‐qPCR signal values at RBMXL1 and ASXL1 loci in U2OS DIvA cells transfected with the indicated siRNAs and either untreated cells (−OHT) or after tamoxifen addition (+OHT). The data represent the mean ± SEM from three independent experiments. The green line represents the background levels of DDX5 signal. The statistical significance of the difference was calculated with unpaired one‐tailed t‐test, and the P‐values show the significant differences between untreated cells (−OHT) and after tamoxifen addition (+OHT). See also Fig EV4D.
- Top: Representative images of immunofluorescence of U2OS DIvA cells depleted of BRCA2 (siBRCA2), DDX5 (siDDX5), or control cells (siC) and either untreated cells (−OHT) or after tamoxifen addition (+OHT), as indicated. Scale bar indicates 10 µm. Bottom: Quantification of the number of γH2AX foci per nucleus (left) and DDX5 nuclear intensity (right). The data represent at least 800 cells per condition from three independent experiments. The red line in the plot indicates the median, and each symbol represents the value of a single cell. The statistical significance of the difference was calculated with Mann–Whitney U‐test, and the P‐values show the significant difference.
Source data are available online for this figure.
