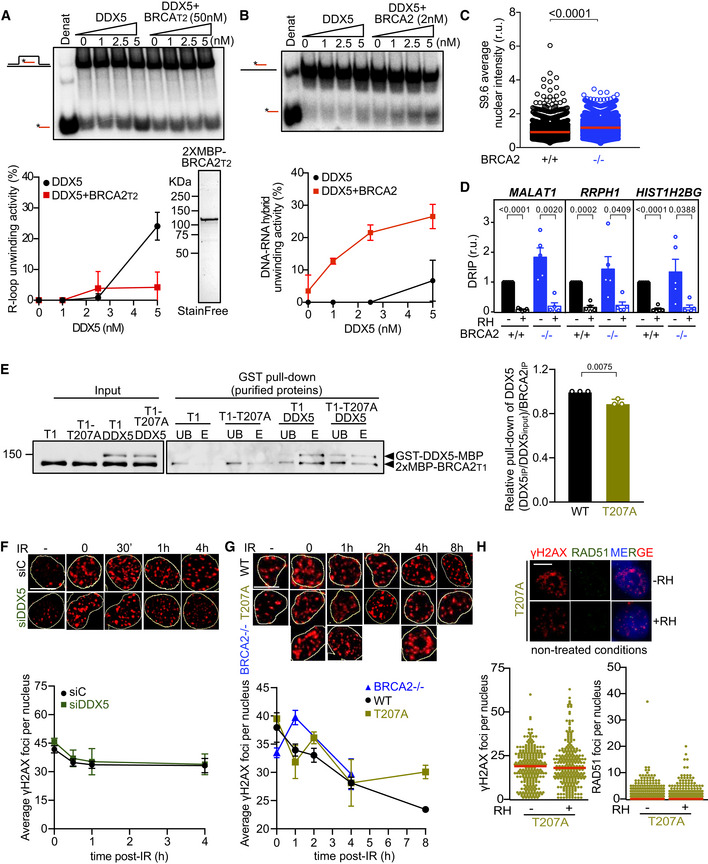
Top: PAGE gel showing a representative unwinding assays in which purified MBP‐DDX5‐GST (1–5 nM) was incubated with 32P‐labeled synthetic R‐loop substrate in the presence or absence of 50 nM purified 2xMBP‐BRCA2T2. Bottom: Quantification of the unwinding experiments showing the percentage of free RNA relative to the R‐loop substrate (unwound product) as a function of DDX5 concentration alone (black) or in the presence of BRCA2T2 (red). Bottom right: SDS–PAGE gel showing 1 μg of purified 2xMBP‐BRCA2T2 used for the unwinding assay. The data represent the mean ± SD of two independent experiments.
Top: PAGE gel showing a representative unwinding assays in which purified MBP‐DDX5‐GST (1–5 nM) was incubated with 32P‐labeled synthetic DNA‐RNA hybrid substrate in the presence or absence of 2 nM purified EGFP‐MBP‐BRCA2. Bottom: Quantification of the unwinding experiments showing the percentage of free RNA relative to the DNA‐RNA hybrid substrate (unwound product) as a function of DDX5 concentration alone (black) or in presence of BRCA2 (red). The data represent the mean ± SD of three independent experiments.
Quantification of the average nuclear intensity of S9.6 antibody in DLD1 BRCA2+/+ (+/+) and BRCA2−/− (−/−) cells. The red line in the plot indicates the median, and each symbol represents the value of a single cell. The data represent at least 2,000 cells per condition from four independent experiments. The statistical significance of the difference was calculated with Mann–Whitney U‐test; the P‐values show the significant difference.
Relative DRIP‐qPCR signal values (respect to the siC level at each locus) at the MALAT1, RRPH1, and HIST1H2BG loci in DLD1 BRCA2+/+ (+/+) and BRCA2−/− (−/−) cells and treated in vitro with RNase H1 (RH) pre‐immunoprecipitation where indicated. The data represent the mean ± SEM from five independent experiments. The statistical significance of the difference was calculated with unpaired Student t‐test, and the P‐values show the significant difference.
GST pull‐down assay using purified BRCA2T1 (T1) or BRCA2T1‐T207A (T1‐T207A) and DDX5. MBP antibody was used for the detection of both proteins. UB: unbound; E: eluate. Right: Quantification of the GST pull‐down experiments calculated as the pulled‐down BRCA2T1 (WT and T207A) with DDX5 relative to the input levels of BRCA2T1 (WT and T207A) and the amount of pulled‐down MBP‐DDX5‐GST. Results are presented as the fold change compared to the BRCA2 WT clone. The data represent the mean ± SD of three independent experiments. The statistical significance of the difference was calculated with unpaired t‐test, and the P‐values show the significant difference.
Top: Representative immunofluorescence images of cells hybridized with anti‐γH2AX antibody in U2OS cells depleted of DDX5 (siDDX5) and in control cells (siC) in cells left untreated (−) or at different time points after exposure to IR (6 Gy), as indicated. Scale bar indicates 10 µm. Nuclei as defined by auto threshold plugin on the DAPI image (ImageJ) are outlined in yellow. Bottom: Graph showing the average number of γH2AX foci. The data represent the mean ± SEM of three independent experiments.
Top: Representative immunofluorescence images of three independent experiments of nuclear γH2AX foci in BRCA2‐deficient DLD1 cells (BRCA2−/−) or BRCA2−/− bearing BRCA2 WT (WT) or BRCA2‐T207A (T207A) variant in cells left untreated or at different time points after exposure to IR (6Gy), as indicated. Scale bar indicates 10 µm. Nuclei as defined by auto threshold plugin on the DAPI image (ImageJ) are outlined in yellow. Bottom: Graph showing the average number of γH2AX foci. The data represent the mean ± SEM of three independent experiments.
Top: Representative immunofluorescence images of DLD1 BRCA2‐T207A stained for γH2AX and RAD51 in non‐treated conditions. When indicated, cells were transfected with a plasmid expressing RNaseH1 (+RH) 48 h prior fixation. Right: Quantification of the number of γH2AX foci (left) or RAD51 foci (right) per nucleus. The data shown are from at least 400 cells per condition from three independent experiments. For statistical comparison of the differences between the samples, we applied a Kruskal–Wallis test followed by Dunn’s multiple comparison test and no statistically significant differences were found. The red line in the plot indicates the median, and each symbol represents a single focus.

