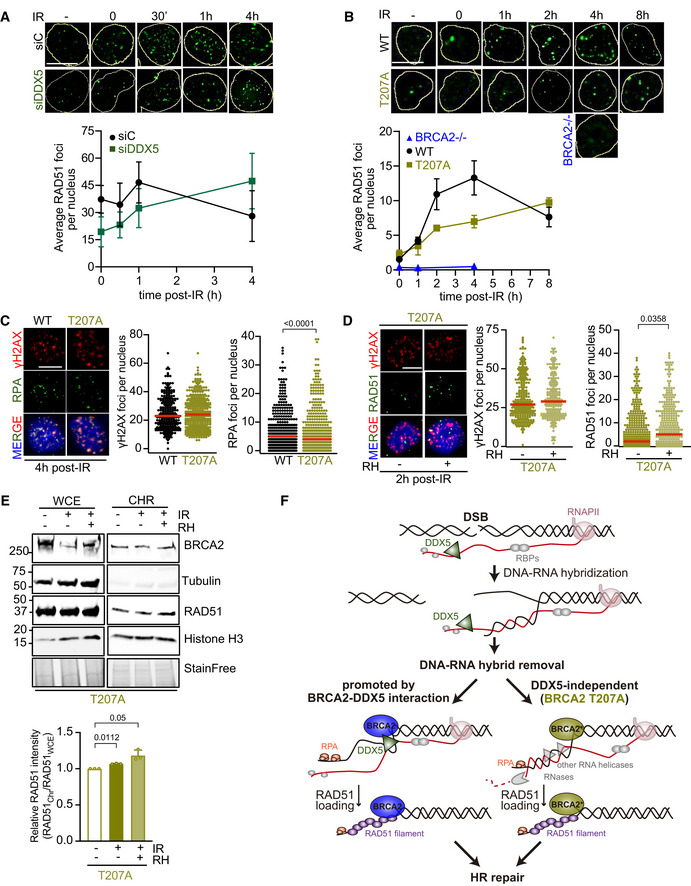
Figure 8. DDX5‐BRCA2 interaction favors DSB repair by homologous recombination.

- Top: Representative immunofluorescence images of cells stained for RAD51 (green) in U2OS cells depleted of DDX5 (siDDX5) and in control cells (siC) in non‐treated (−) or different time points after exposure to IR (6 Gy), as indicated. Scale bar indicates 10 µm. Bottom: Graph showing the average number of RAD51 repair foci in both cell lines. The data represent the mean ± SEM of three independent experiments. See also Fig EV5A.
- Top: Representative immunofluorescence images of DLD1 BRCA2‐deficient cells (BRCA2−/−) or BRCA2−/− cells expressing BRCA2 WT (WT) or BRCA2‐T207A (T207A) in non‐treated or at different time points post‐IR (6 Gy), as indicated; hybridized with anti‐RAD51 antibody (green). Scale bar indicates 10 µm. Bottom: Graph showing the average number of RAD51 repair foci in the three cell lines. The data represent the mean ± SEM of three independent experiments. See also Fig EV5G.
- Left: Representative immunofluorescence images of DLD1 BRCA2 WT or BRCA2‐T207A cells 4 h post‐irradiation (6 Gy) hybridized with anti‐γH2AX and anti‐RPA antibodies. Right: Quantification of the number of γH2AX and RPA foci per nucleus, as indicated. The data represent at least 400 cells per condition from two independent experiments. For statistical comparison of the differences between the samples, we applied a Kruskal–Wallis test followed by Dunn’s multiple comparison test and the P‐values show significant differences. The red line in the plot indicates the median, and each symbol represents a single focus.
- Left: Representative immunofluorescence images of DLD1 BRCA2‐T207A cells 2 h post‐irradiation (6 Gy), as indicated, hybridized with anti‐γH2AX and anti‐RAD51 antibodies. (RH) RNase H. Right: Quantification of the number of γH2AX foci (left) or RAD51 foci (right) per nucleus. When indicated, cells were transfected with a plasmid expressing RNase H1 (RH) 48 h prior fixation. The data shown are from at least 400 cells per condition from three independent experiments. For statistical comparison of the differences between the samples, we applied a Kruskal–Wallis test followed by Dunn’s multiple comparison test and the P‐values show significant differences. The red line in the plot indicates the median, and each symbol represents a single focus. See also Fig EV5H.
- Top: Subcellular fractionation showing amount of RAD51 in DLD1 stable clones expressing BRCA2‐T207A (T207A) in chromatin fraction. When indicated, cells were irradiated (2 h treatment) and/or transfected with a plasmid expressing RNase H1 (RH) 48 h prior fixation. α‐Tubulin and histone H3 signals are shown as markers of cytoplasmic and chromatin fraction, respectively. Bottom: Quantification of RAD51 levels detected by Western blot with a RAD51‐specific antibody in chromatin fraction relative to RAD51 levels in WCE. Results are presented as the fold change compared to the untreated sample. The data represent the mean ± SD of three independent experiments. The statistical significance of the difference was calculated with unpaired t‐test, and the P‐values show the significant difference.
- Model. DNA‐RNA hybrid formation may be enhanced in the vicinity of DSBs due to the DNA rotation freedom provided by the break. Left: Through its interaction with DDX5, BRCA2 helps retain DDX5 at DSBs and stimulates its helicase activity to resolve the DNA‐RNA hybrids. Removal of the RNA from the hybrid would trigger RPA binding to the exposed ssDNA followed by the subsequent loading of RAD51 by BRCA2 and the displacement of RPA to resume HR. Right: When the interaction of BRCA2 with DDX5 is impaired as in cells bearing the breast cancer variant BRCA2‐T207A, DDX5 would not mediate hybrid removal, leading to hybrids that persist longer delaying the coating of the ssDNA by RPA. Eventually, the RNA from the hybrids would be cleared by other nucleases and helicases such as RNase H1 or Senataxin in a likely less efficient manner.
Source data are available online for this figure.
