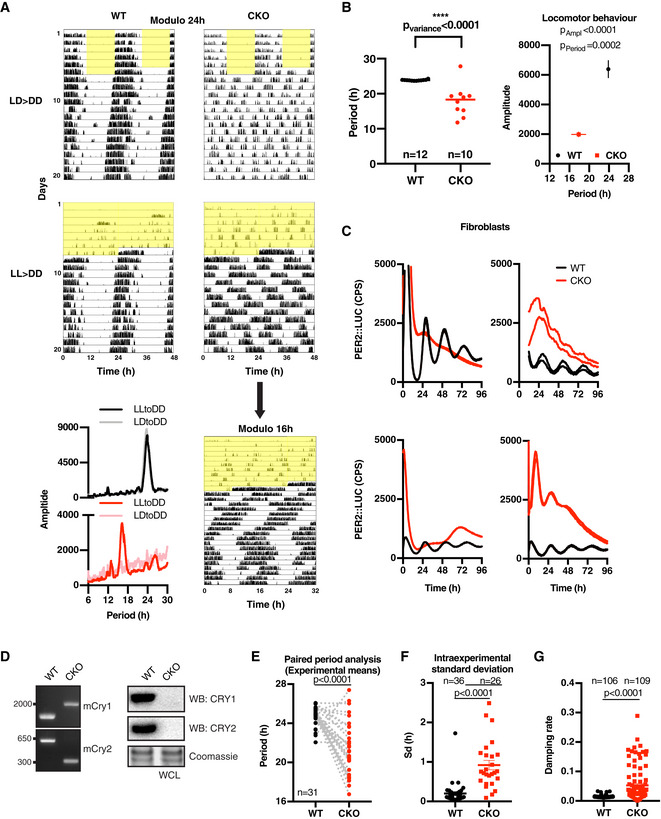
Figure EV1. CRY‐independent circadian timekeeping occurs cell‐autonomously.

- Representative double‐plotted actograms showing wheel‐running activity of WT and CKO mice during 12 h:12 h light:dark (LD) cycles (yellow shading indicating lights on) (top) or during constant light (LL) (bottom) and thereafter in constant darkness (DD). Top four figures have same x‐axis (modulo 24 h). Rhythmic behaviour of CKO mice in LL > DD condition becomes clear when plotting the data in 16‐h modulo (i.e. x‐axis being 32 h). LD figure WT modulo 24‐h and CKO modulo 16‐h are also presented in Fig 1A. Bottom left, representative periodograms of WT and CKO mice over 2 weeks in constant darkness, following either 12 h:12 h light:dark cycles or constant light.
- A second experimental cohort highlights significant differences in period variance (left, horizontal line represents mean, F‐test for variance); period and amplitude (right) of CKO (n = 10) vs. WT (n = 12) mice over 2 weeks in constant darkness following 1 week under constant light (mean ± SEM, 2‐way ANOVA with Sidak’s MCT).
- Examples of independent bioluminescence recordings of PER2::LUC expression in CRY‐deficient fibroblasts showing variability in shape and baseline of rhythmic CKO traces. Two representative traces are shown per experiment. Stringent entrainment, e.g. with temperature cycles or dexamethasone, increases the likelihood of observing rhythmicity, but only in approximately 30% of the experiments did we observe clearly rhythmic expression of PER2::LUC over 3 cycles. Despite our best efforts, over many years, we were unable to identify a set of entrainment and recording conditions that consistently produced CKO PER2::LUC rhythms and we were forced to conclude that more variables were at play than we were adequately able to control for.
- Genotyping CKO fibroblasts used throughout this study. Left: PCR genotyping shows the expected pattern of CRY1 and CRY2 knockout. Right: Western blot analysis of whole cell lysates (WCL) and probed with antibodies against CRY1 and CRY2.
- Interexperimental comparison of PER2::LUC periods in WT vs. CKO fibroblasts. Paired comparison of period means of experiments used for Fig 1F where CKO traces were rhythmic. P‐values were calculated by paired t‐test.
- Intraexperimental standard deviations (i.e. between replicates) were calculated for all experiments with > 3 rhythmic traces (mean ± SEM). P‐value was calculated by unpaired t‐test.
- Damping rates of all individual detrended traces of example experiments shown in Fig EV1E were calculated by damped sine wave fitting (mean ± SEM, WT n = 106, CKO n = 109). P‐value was calculated by unpaired t‐test with Welch correction.
Source data are available online for this figure.
