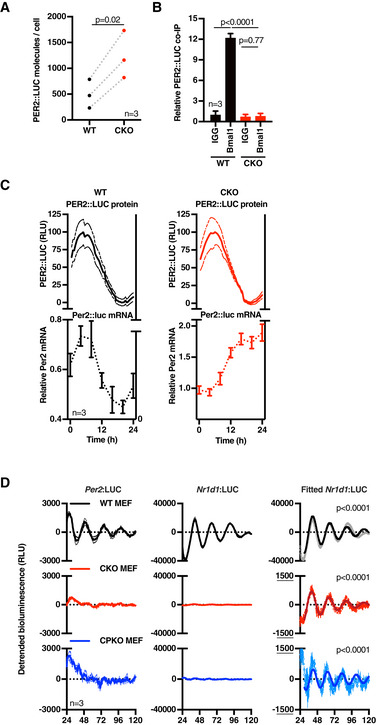
Figure 3. CRY‐independent rhythms are regulated post‐transcriptionally.

- Mean number of PER2::LUC molecules per cell at the estimated peak of PER2 expression for each cell line (mean of three experiments, n = 3 each). P‐values were calculated by paired t‐test.
- PER2::LUC binding to BMAL1 in WT and CKO cells. Cells were harvested at the peak of PER2 expression, BMAL1 was immunoprecipitated, and PER2::LUC binding was measured by bioluminescence measurements (n = 3, mean ± SD). P‐values were calculated by unpaired t‐test.
- Per2 mRNA levels in WT (left) and CKO (right) cells were determined by qPCR over one circadian cycle (bottom), whilst PER2::LUC bioluminescence (top, min‐max normalised) was recorded from parallel cultures. Per2 mRNA reported relative to Rns18s (bottom), n = 3, ± SEM; PER2::LUC (top) presented as mean (solid) ± SEM (dashed), n = 3. The WT mRNA trace was preferentially fit by a circadian damped sine wave compared with straight line (P = 0.0412, extra sum‐of‐square F‐test), whereas CKO data were not (ns).
- Detrended Per2 and Nr1d1 promoter activity in WT, CKO and quadruple Cry1/2‐Per1/2 knockout (CPKO) mouse embryonic fibroblasts (MEFs) recorded at 37°C, n = 3, mean (solid) ±SEM (dashed). Nr1d1 data were preferentially fit with a circadian damped sine wave over straight line (P < 0.0001, extra sum‐of‐squares F‐test) (right hand graphs, solid lines; error bars, SEM). Similar recordings performed at 32°C and an expanded view of Per2 data are presented in Fig EV3E and F.
