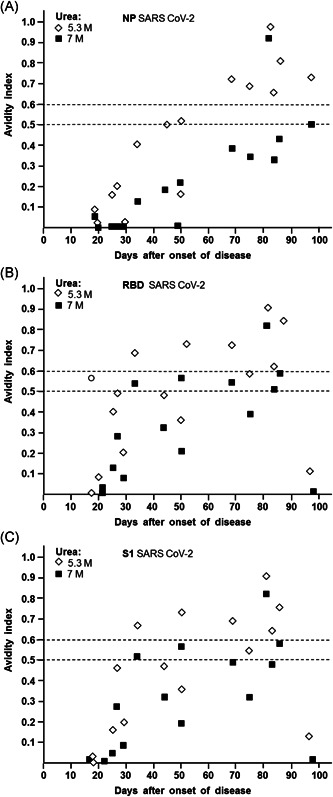
Figure 3.

Dependency of avidity indices of IgG towards NP, RBD, and S1 of SARS‐CoV‐2 on the time after onset of disease. Avidity indices were taken from the experiment described in Figure 1 and Figure S1, and were plotted against the time between onset of disease and serum acquisition. The avidity indices obtained after treatment with 5.3 and 7 M urea are shown for IgG directed towards (A) NP, (B) RBD, and (C) S1. (A) The curves obtained for 4 and 7 M urea are clearly separated (p < 0.001). For treatment with 5.3 M urea, an avidity index of 0.5 seems to be suitable for discrimination between sera taken before or after 50 days after onset of disease (p =0.015). However, as already outlined in Figure 2A, the use of 7 M urea and an avidity index cut‐off of 0.3 is more significant and therefore better suitable for practical use. (B, C) Due to the higher variability of the avidity indices for IgG directed towards RBD and S1, compared to the values obtained for NP under A, the overlap between the curves for 5.3 and 7 M urea are strong. In addition, the high variability of the avidity indices and the relative low number of cases does not allow to define a significant point of differentiation between acute and past infection. IgG, immunoglobulin G; NP, nucleoprotein; RBD, receptor‐binding domain; SARS‐CoV‐2, severe acute respiratory syndrome coronavirus 2
