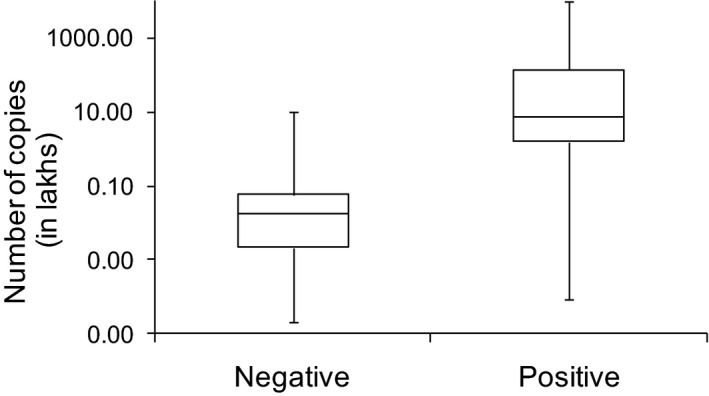
FIGURE 1.

Patients with positive WMF antigen test have higher SARS‐CoV2 copies in their NPS samples. X‐axis denotes negative (n = 12) and positive (n = 15) categories of the WMF antigen test. Y‐axis denotes the number of SARS‐CoV2 copies. The interquartile range shows the 25%–75% range of the virus copies in each category. The error bars depict the minimum and maximum copy numbers in each category
