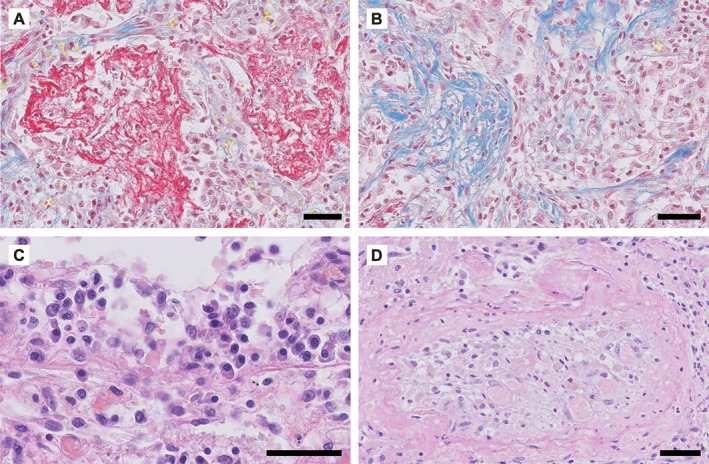
Figure 5.

Representative examples of COVID‐19‐associated lung pathology. Panels A, B, and D show photomicrographs of the lung tissue of a 55‐year‐old male who died of COVID‐19 4–5 weeks after admission to the intensive care unit (ICU) of the University Medical Center Groningen. Panel C is from a 63‐year‐old male who died 2.5 weeks after admission to the ICU. (A) Alveolar spaces are filled with fibrin, stained in red. (B) Organising pneumonia is observed with fibrosis in blue; fibroblast proliferation can be observed on the right hand side. (C) Lymphoplasmocytic infiltration. (D) Occluded artery (thrombosis) with recanalization. (A, B) Martius scarlet blue; (C, D) H&E. Scale bar = 50 μm.
