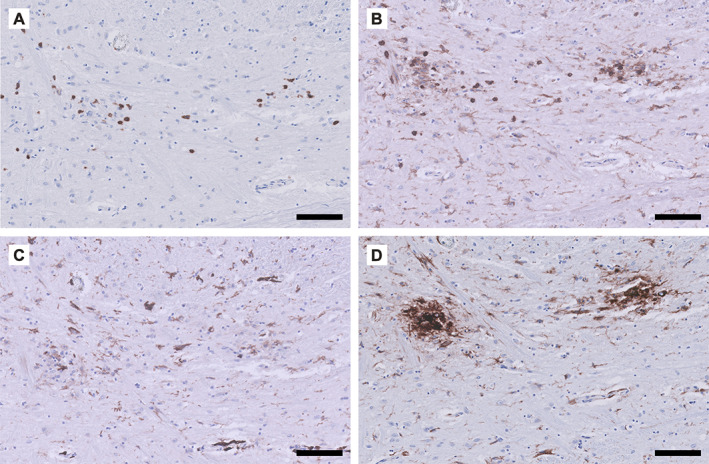
Figure 7.

Phenotype of the inflammatory response observed in COVID‐19‐associated brain pathology. Detailed micrographs from the tegmental area of the medulla oblongata in a patient (male, 63 years) who died 2.5 weeks after admission to the ICU. Immunohistochemical staining for (A) CD3 (T‐cells), (B) CD45 (leukocytes including microglia), (C) CD163 (scavenger receptor, activated microglia), and (D) HLA‐DR (MHC class II, activated microglia). The T‐cell infiltrate (A) co‐localises with activated microglia (C and D). Scale bar = 100 μm.
